


Recently, we shared a backtest of Mantic’s Q2 earnings forecasts for 50 S&P 500 companies. Since early September, we’ve been forecasting Q3 earnings per share (EPS) and revenue live for every company in the index, with weekly updates and a final forecast the day before each announcement.
More than 400 companies have now reported. How has Mantic performed? Point forecasts outperform analyst consensus, while beat probabilities compare favourably with historical beat rates and are competitive with prediction market prices. Mantic’s forecasts also make more efficient use of new information than analysts’ estimates and contain predictive information beyond prediction market prices.
More accurate than consensus
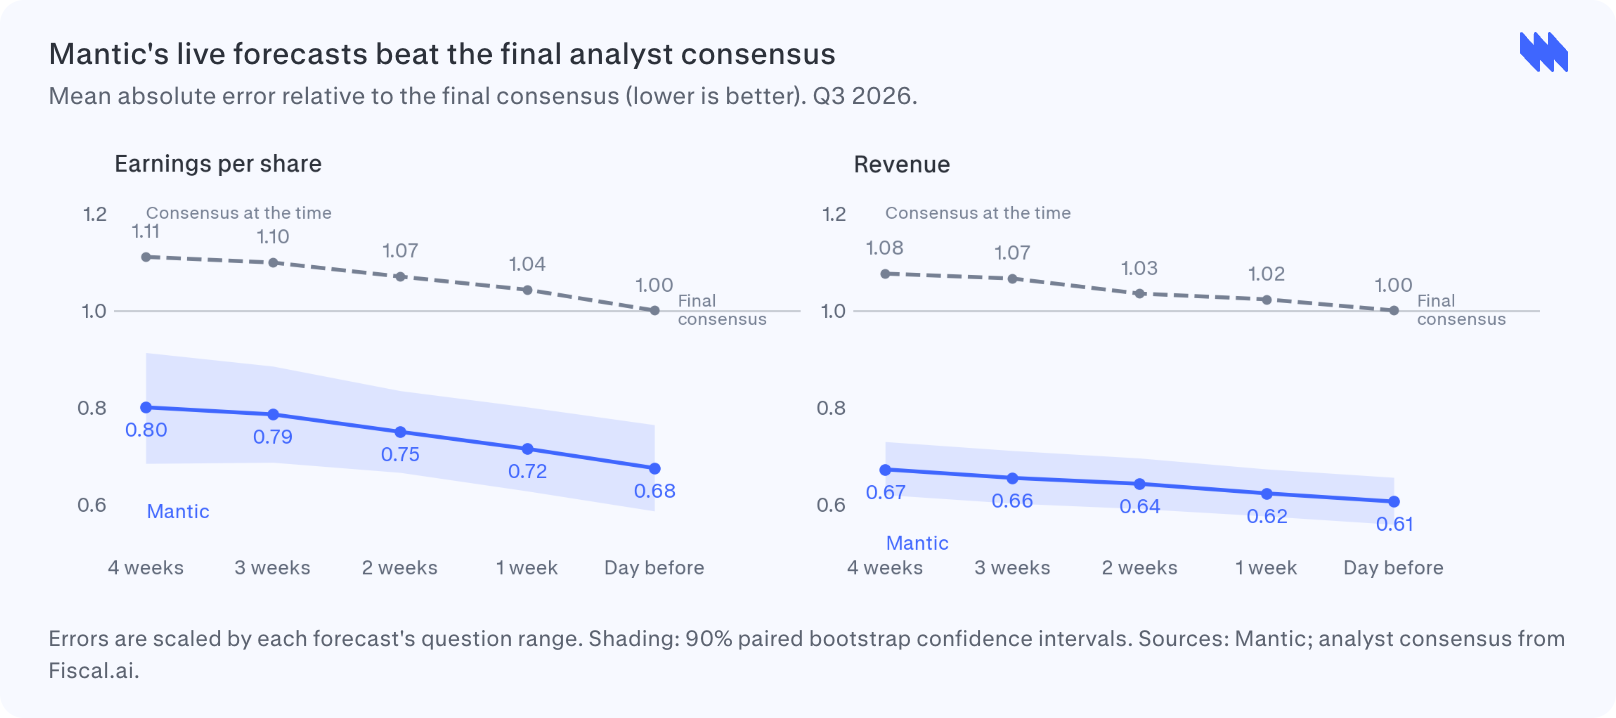
Mantic’s median forecasts have lower mean absolute error than the final analyst consensus at every horizon from four weeks before a company reports. Four weeks out, Mantic’s error is 20% lower than the final consensus error for EPS and 33% lower for revenue; the day before, it is 32% and 39% lower, respectively. Against the consensus available at the time, Mantic’s advantage is even larger.
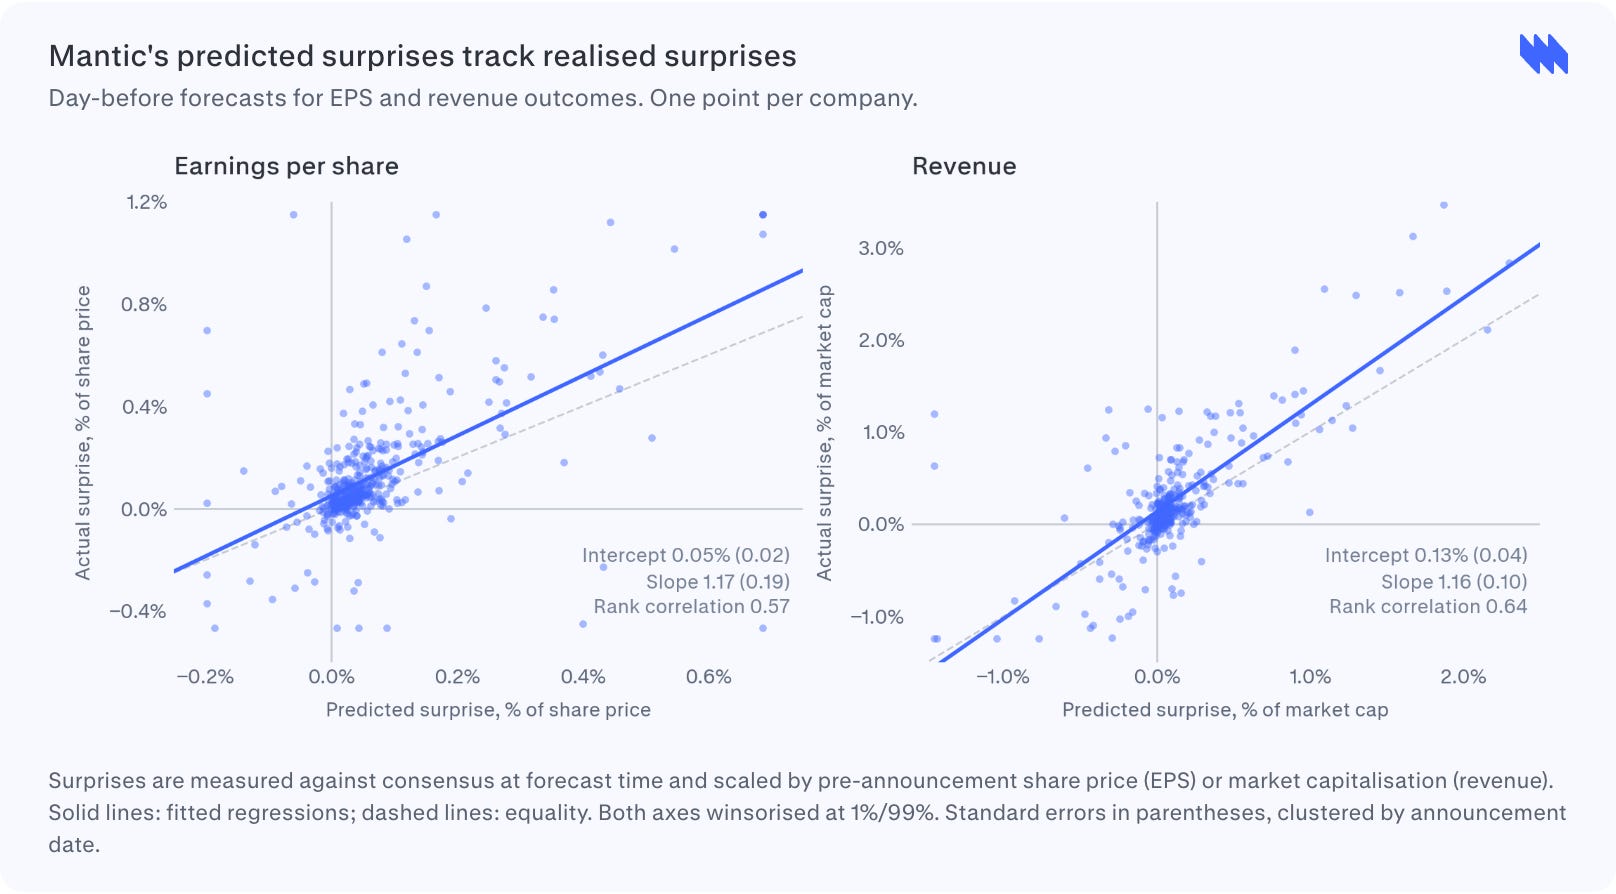
Mantic’s predicted surprise — the gap between its median forecast and the consensus at forecast time — is positively associated with the actual surprise. The day before earnings, the rank correlations are 0.57 for EPS and 0.64 for revenue. The fitted slopes are close to one, consistent with correctly scaled predicted surprises. Both intercepts, however, are significantly positive: Mantic ranks surprises well but understates reported EPS and revenue on average.
Benchmarking beat probabilities
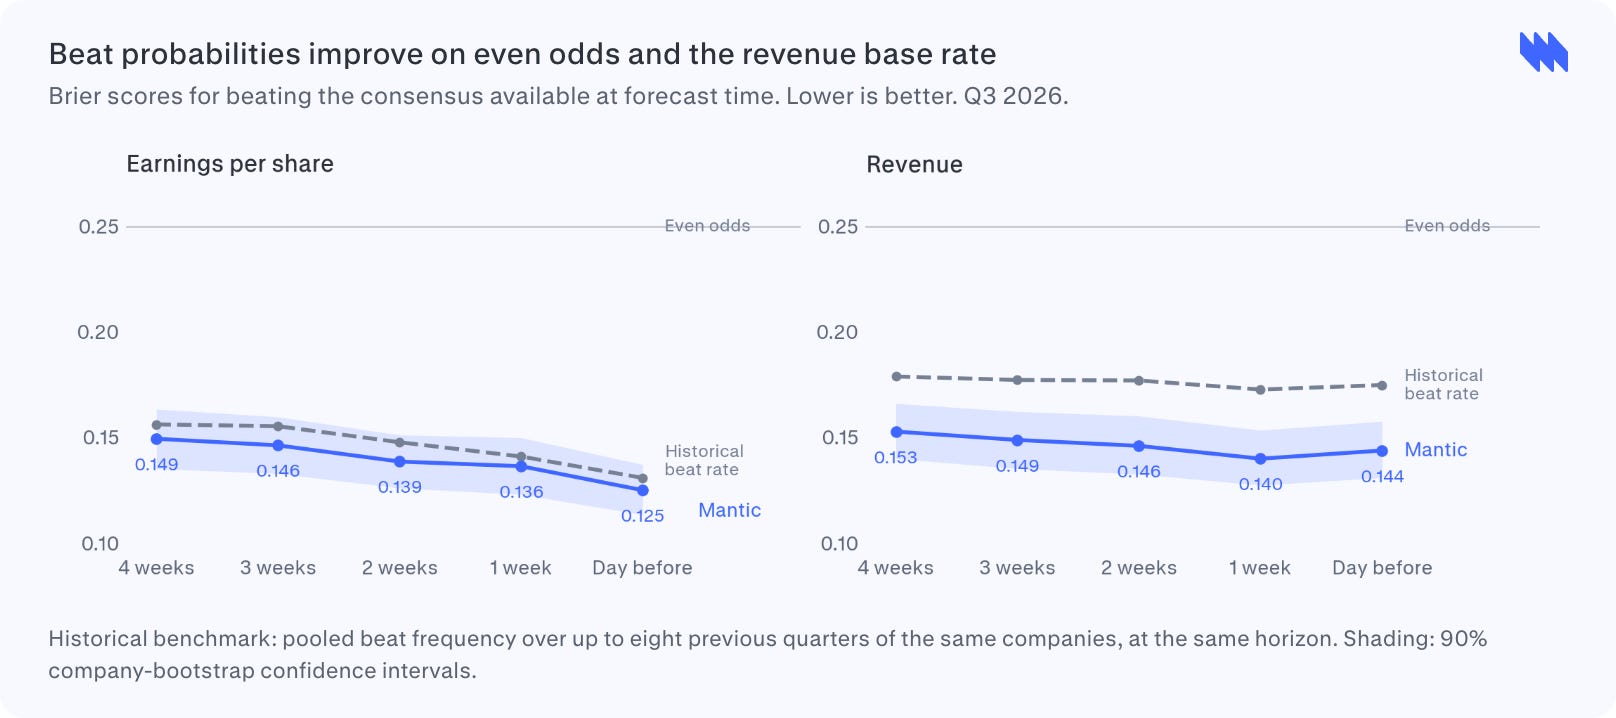
Mantic’s forecast distributions also give the implied probability that a company beats consensus. Firms beat consensus well over half the time, a well-documented bias in sell-side analyst forecasts. The historical beat rate for the same companies therefore provides a harder benchmark than even odds. We score Mantic’s probability of beating the consensus at forecast time against both benchmarks, constructing the historical rate by pooling up to eight prior quarters per company and using consensus estimates at the same forecast horizon.
Mantic improves on even odds for both EPS and revenue at every horizon. Against the historical benchmark, its Brier scores are lower for both metrics. The improvement is statistically significant for revenue; for EPS, the difference is small and not significant.
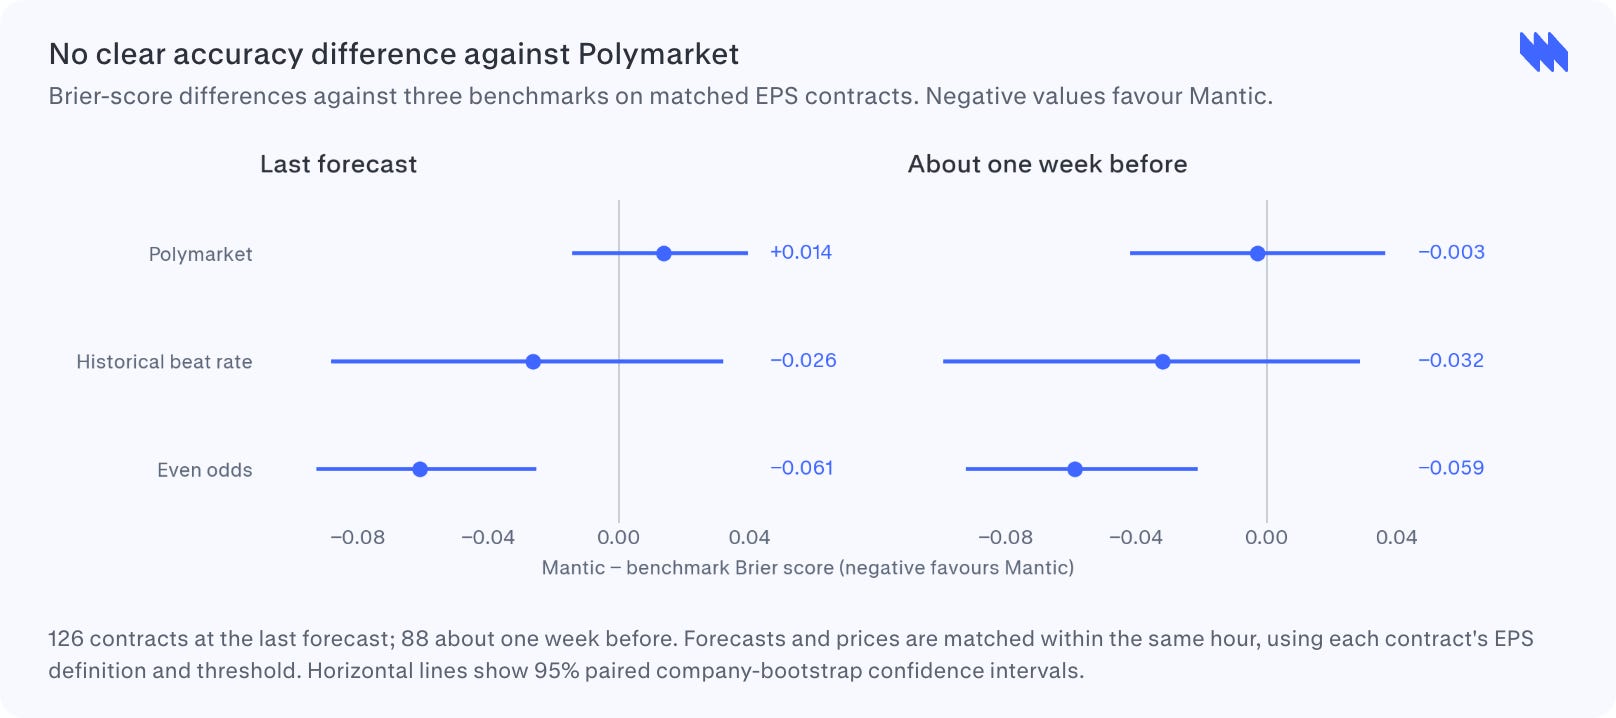
Prediction market prices provide another benchmark. Polymarket’s earnings contracts ask whether a company will beat a fixed consensus threshold. We compare 126 contracts with matching EPS definitions, calculating Mantic’s probability against each contract’s threshold and matching it with the market price from the same hour.
Polymarket scores better at the last forecast; Mantic scores slightly better about a week before. Neither difference is statistically significant.
Mantic’s beat probabilities also contain predictive information beyond Polymarket prices. Conditional on the market price, companies assigned higher probabilities by Mantic are more likely to beat consensus. This relationship is statistically significant both at the last forecast and one week before earnings.1
Responding to new information
Earnings season provides a useful setting for studying how forecasts respond to new information. Forecasts can be accurate yet respond too little or too much to news.
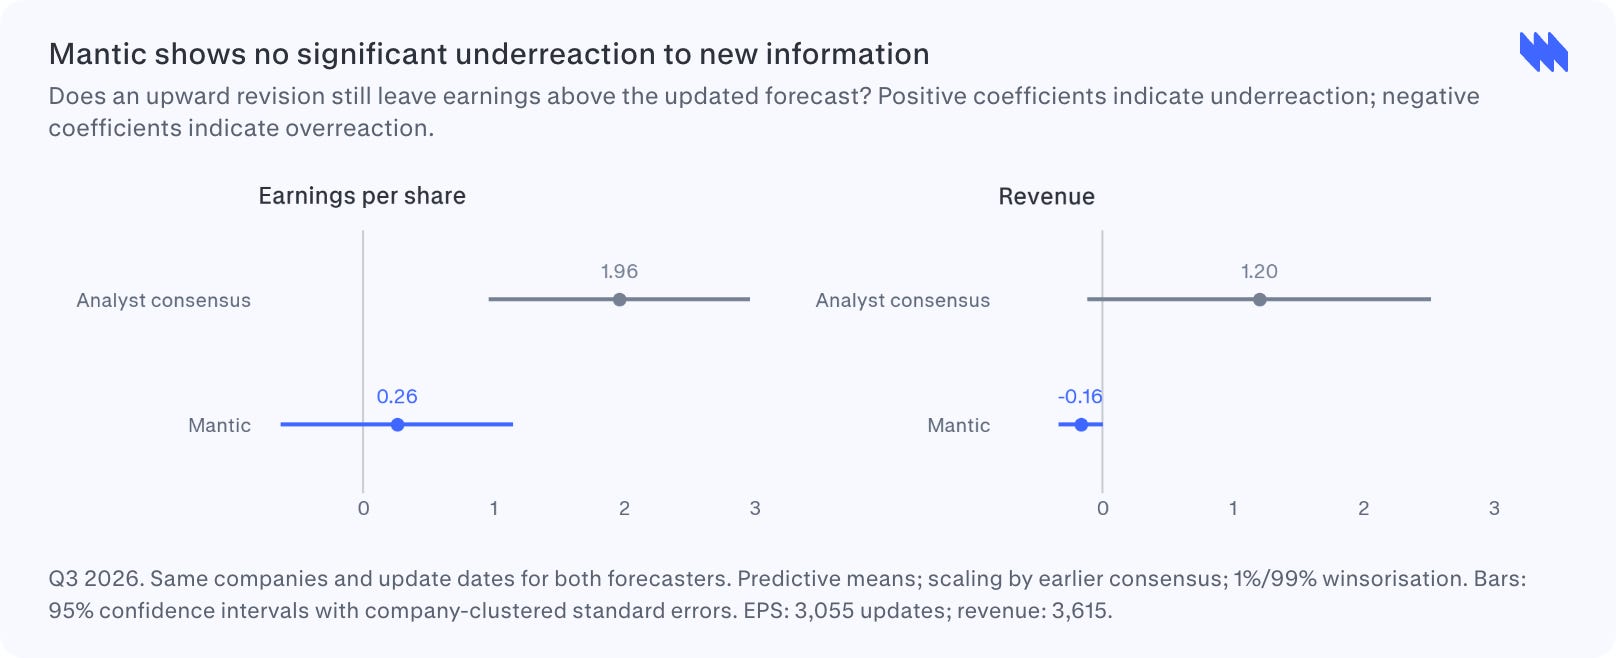
Underreaction in analysts’ earnings forecasts is well documented.2 We test whether Mantic exhibits the same information rigidity by regressing forecast errors on its own forecast revisions.3 If an upward revision is systematically followed by a result above the revised forecast, the revision underreacts; an error in the opposite direction suggests overreaction.
The analyst consensus underreacts to new information for both EPS and revenue. Mantic shows no significant underreaction for either metric, with weak evidence of slight overreaction for revenue. Its coefficients are significantly lower than those for the analyst consensus and closer to the rational benchmark of zero, suggesting more efficient use of new information.
We will keep tracking the remaining announcements. Reach out for the full technical report, including additional results.
We estimate bi = α + βM pi + βP qi + εi, where bi is the contract outcome, pi is Mantic’s probability and qi is the Polymarket price, matched within the same hour. Mantic’s coefficient is 0.81 (s.e. 0.31) at the last forecast and 0.83 (0.23) one week before. Standard errors are clustered by announcement date.
See, for example, Bouchaud et al. (2019).
Following Coibion and Gorodnichenko (2015), we estimate yi − Fi,t = α + β(Fi,t − Fi,t−1) + εi,t, relating the updated forecast’s error to its latest revision. Positive coefficients indicate underreaction; negative coefficients indicate overreaction. We use Mantic’s predictive mean and analyst forecasts matched to the same companies and dates, with standard errors clustered by company.