

Earnings season is upon us. We recently compared Mantic’s forecasts with Polymarket. This time, we turned to another benchmark: the analyst consensus on company earnings.
Across 50 S&P 500 companies’ Q2 2026 results, Mantic’s forecasts made eight weeks before each release had 34% lower error than the final analyst consensus on earnings per share (EPS), and 24% lower error on revenue. Forecasts made the day before did about as well.
This is a backtest – we ran each forecast with information cut off at the date it would have been made. We are now forecasting the Q3 earnings season live for all S&P 500 companies, and close this post with ten hashes of our predictions.
The setup
We draw five companies at random from each market-cap decile, so the sample spans the S&P 500's size distribution. For each company, we run Mantic’s forecast for EPS and revenue at six points before the Q2 release: the day before, and 1, 2, 4, 8 and 16 weeks prior.1 A forecast only uses information available at the close of that day.
We measure the absolute error of Mantic’s median forecast and of the analyst consensus against the reported figure.2 Since companies vary in size, we normalise each error by the span of plausible values its forecast question covers, so each company counts equally.3
Accurate from eight weeks out
Mantic’s accuracy barely changes between eight weeks out and the day before. Consensus, by contrast, improves slightly. Eight weeks out, Mantic’s error is 34% lower than final consensus on EPS and 24% lower on revenue, while consensus’s own error at that point in time is 5% and 12% higher than its final value.
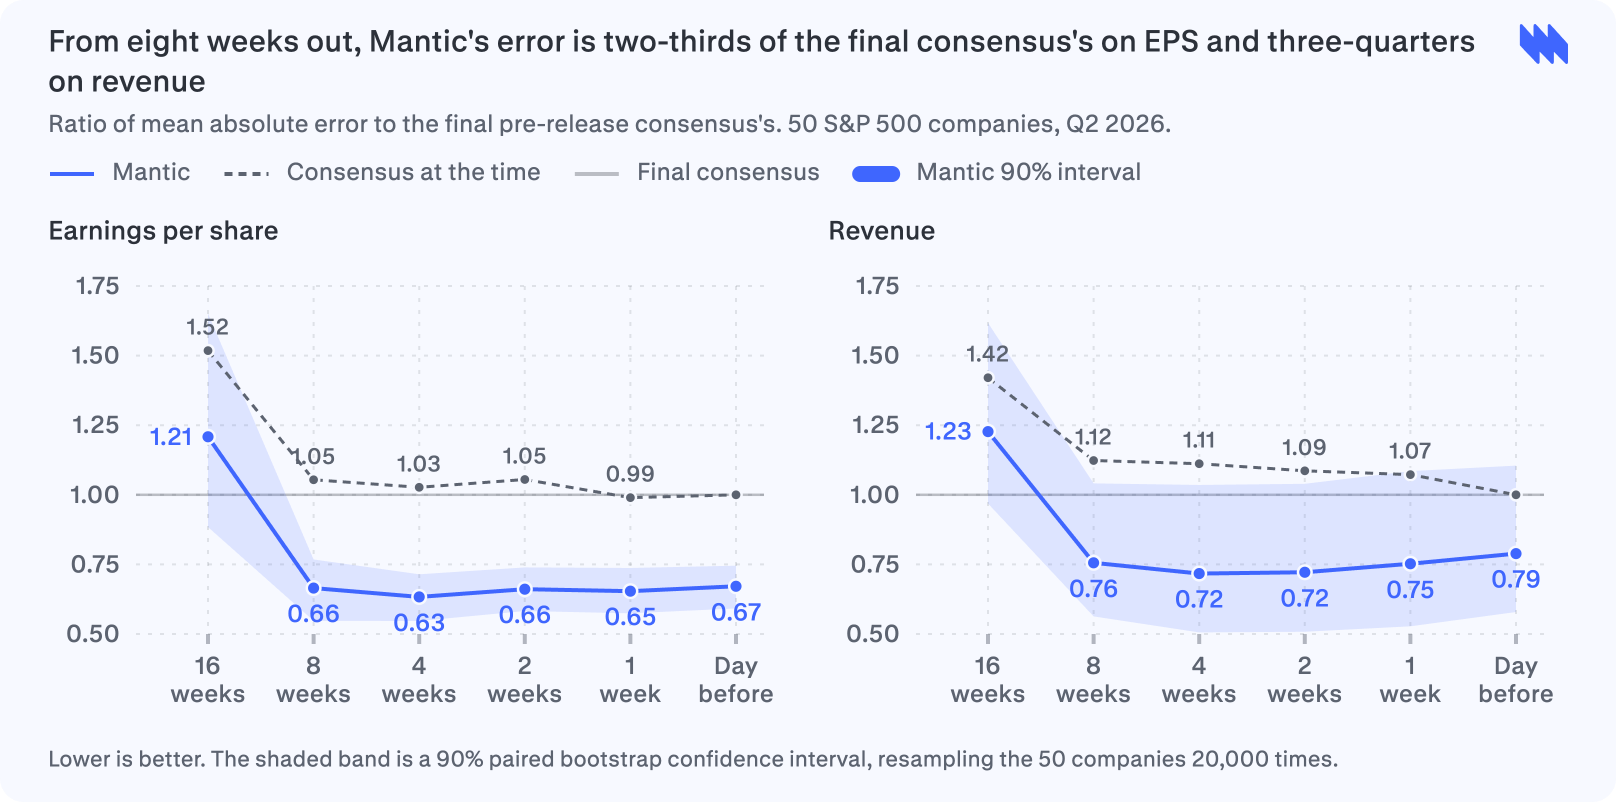
At 16 weeks, the advantage over the final consensus disappears. That far out, none of the companies have even reported the previous quarter to the one we’re forecasting, so the forecasts look two quarters past the latest results. Mantic’s errors are 21% larger than the final consensus on EPS and 23% larger on revenue, but still smaller than the consensus available at the time.
The EPS gain is broad: the day before results, Mantic is closer than the final consensus for 43 of 50 companies. On revenue the gain comes from fewer, larger wins, so its intervals are wider.4
Forecast differences tracked earnings surprises
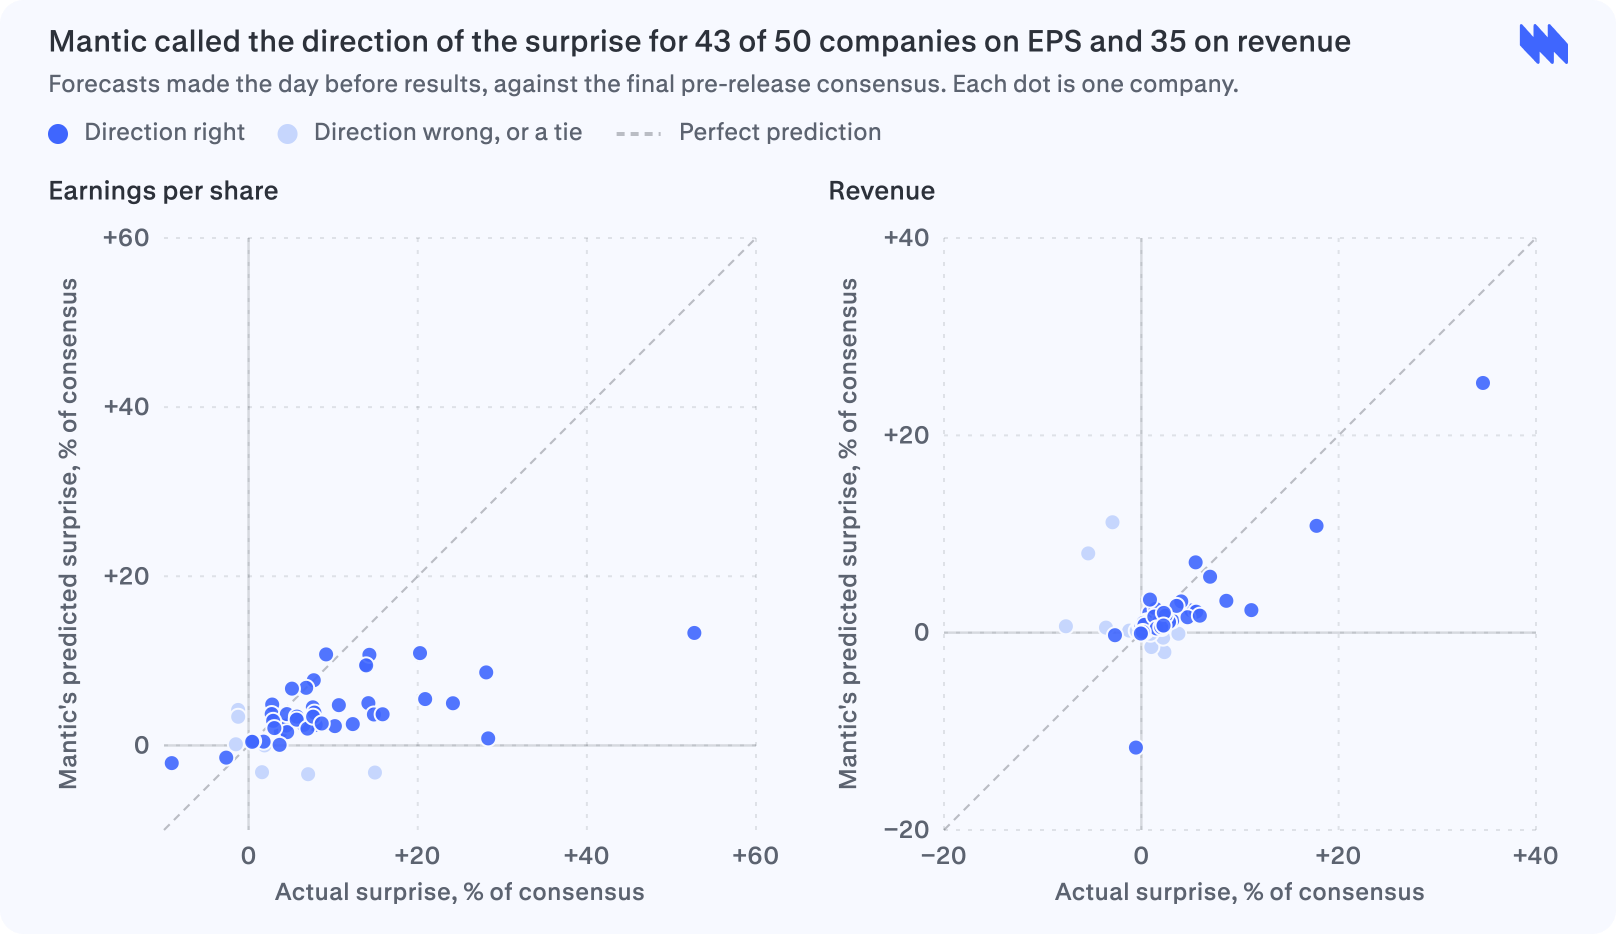
Mantic calls the direction of the surprise for 43 of 50 companies on EPS and 35 on revenue. The size of its predicted surprise (i.e. Mantic’s forecast relative to consensus) is also informative: predicted and realised surprises have rank correlations of 0.55 for EPS and 0.48 for revenue. Mantic does, however, tend to underpredict surprises.5
Beat probabilities improve on even odds
Each Mantic forecast is a full distribution, so it also gives a probability that the company beats the consensus on the forecast date. We score these probabilities with the Brier score.6
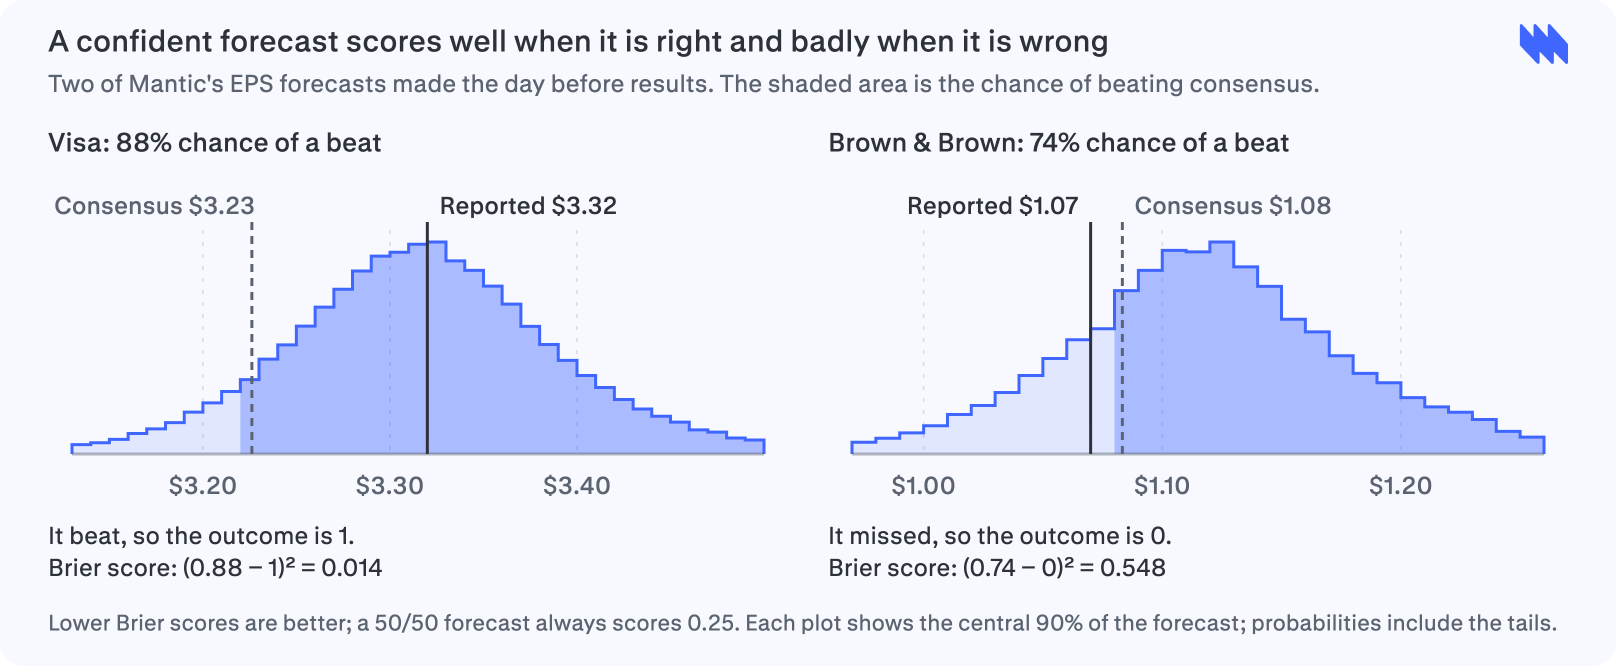
A 50/50 forecast scores 0.25. Mantic outperforms this benchmark at every lead time, with a Brier score 48% lower on EPS and 34% lower on revenue for forecasts made one day before results.
Companies tend to beat consensus more often than miss, so their own historical beat rate is a stronger benchmark. On revenue, Mantic’s Brier score is 18–33% lower than this benchmark’s from eight weeks to one week out. On EPS, the two are within 8% of each other from two to eight weeks out, and Mantic falls behind closer to results.
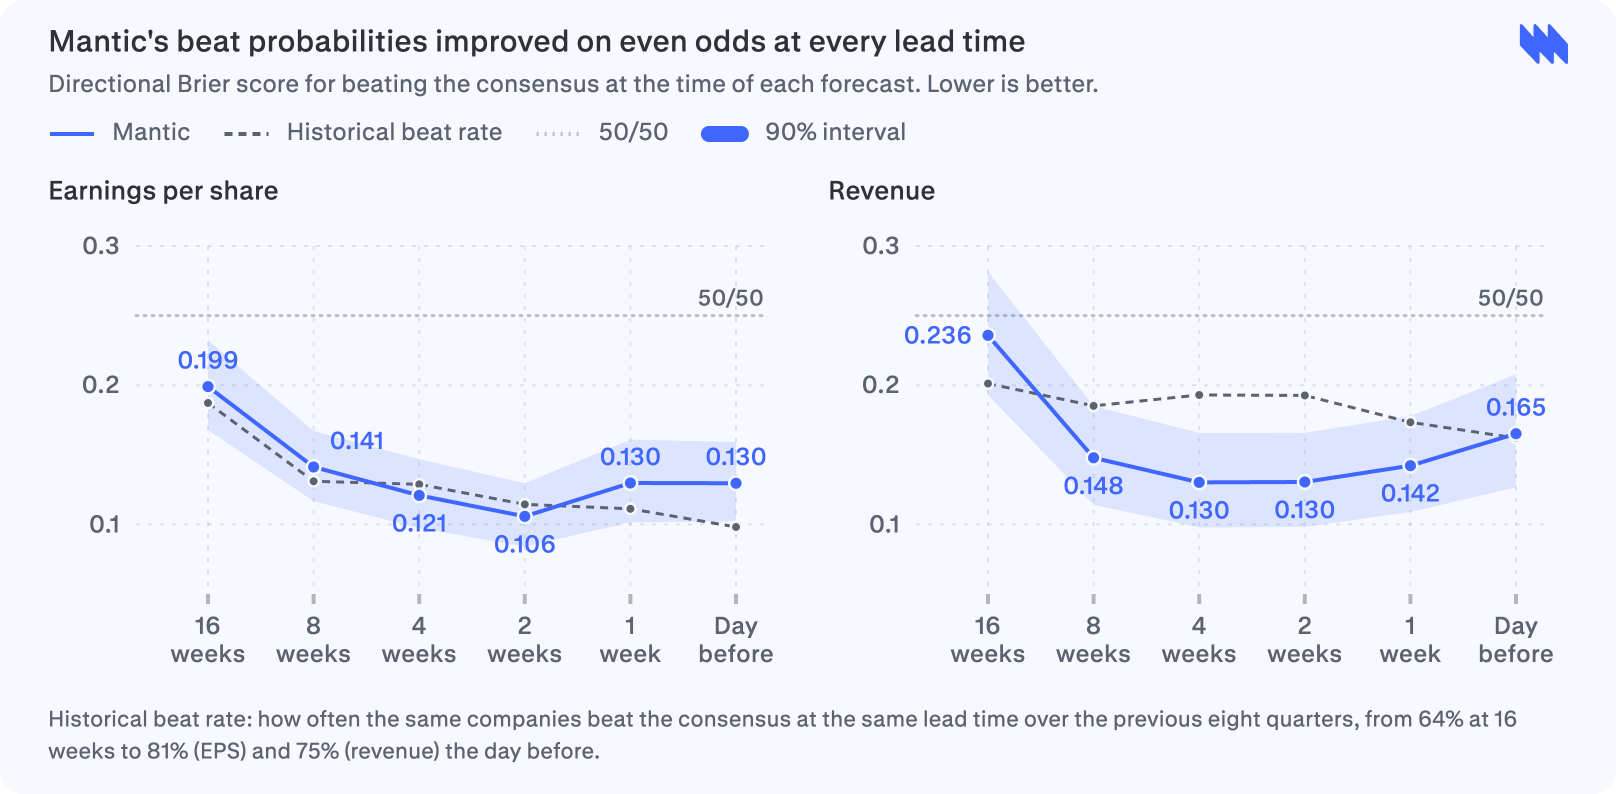
The EPS shortfall reflects an unusually strong quarter in Q2: 45 of 50 companies beat the final consensus, against a historical rate of 81%, while Mantic’s average beat probability is 68%.
The next test is underway
These are encouraging results from a small sample of 50 companies over a single quarter. The next test is whether the advantage persists across the entire index, with forecasts made live.
We’re now forecasting the upcoming Q3 earnings season live across the S&P 500. We’ll share the results at the end of earnings season in a follow-up post. Below are SHA-256 hashes of our latest forecasts for 10 upcoming releases:
Autodesk EPS:
c6fd0b1aab17ae49745fc619411ba2b6031b508a2a8d00b2d290edd2e37b9bebDell Technologies EPS:
309b1ab2c2062367f286aec771dae8fa33404dc3c4ef315f304100e55838b23dHome Depot revenue:
9da460b1c726449354dc9ba005e0294a7a5cdbbbb3faf69fc060fff4e501ee54HP Inc revenue:
d1e8bf193cb55ad6646b15d4565a4216dc3634261558c851a9a79d74e43f7923Intuit revenue:
800b54b1da8e0371b72ac732a979284d9d61f80cebd0b0446b6b8d2b7134b3d3Lowe’s EPS:
bc447fab7a4b5e34f771a306d579b29f098e1fd0bbb1ef603bbb656341c9ddbcNvidia EPS:
d1a3ad5ec0de41631745f04d0bf74d84e7a0f19e42435c9578a9530534b9e8c6Nvidia revenue:
2830f1accfe2fd3dbbd8c9d10e12a9665db551177633f2ba38f54b8c400c903dPalo Alto Networks EPS:
054c0ec4bbb013d6802f33a0abcc07500e1ab39994308d60d2331e0a9ca39a2dRoss Stores revenue:
c7335dec06ad90a943b2bbb42a426da944deb9a55104dc0088962e0ed0067ca1
To explore earnings forecasts with Mantic, reach us at contact@mantic.com.
Sampling uses market caps as of 1 May 2026. Releases ran from 14 July to 12 August 2026, covering the quarter ending June. Headline EPS was adjusted (non-GAAP) for 41 companies and GAAP for nine.
Point-in-time consensus figures are taken from Fiscal.ai; the final consensus is the last estimate before each release. Mantic’s point forecast is the median of its forecast distribution.
We report range-normalised mean absolute error: the usual MAE, with each company’s error divided by the width of its forecast’s range, or the average over companies of 100 × |forecast − reported| ÷ (range maximum − range minimum). For example, PayPal’s EPS question had a range of $0.32 to $2.24, a width of $1.92. Mantic’s median of $1.33 missed the reported $1.38 by 5 cents, a range-normalised error of 2.6%; the consensus of $1.28 missed by 10 cents, 5.2%.
Revenue intervals are wide because of five energy and utility companies (ONEOK, Devon Energy, Constellation Energy, PSEG and Expand Energy), whose reported revenue includes commodity sales and hedge gains. Errors on these are several times larger than elsewhere. Without them, the result barely changes: Mantic’s revenue error is 22–26% lower than the final consensus from eight weeks to one week out, and the 90% intervals sit above zero.
Surprises are 100 × (value − consensus) / |consensus| against the final consensus, using Mantic’s median for predicted surprises and the reported figure for actual ones. A flat forecast or outcome doesn’t count as a correct direction. Rank correlations are Spearman’s.
The Brier score is the average of (p − o)², where p is the beat probability and o is 1 for a beat and 0 for a miss. Results exactly equal to consensus are excluded. A 50/50 forecast assumes consensus is the median of plausible outcomes. The historical benchmark is the share of beats against the consensus at the same lead time, pooled across the 50 companies over Q2 2024 to Q1 2026.
Some of this on EPS level is somewhat technical due to whether adjusted EPS or GAAP eps is being forecast. So some of this is better tested at revenues which you do.
Alongside this Mantic should try and forecast if stock will likely close up or down on the day. That would be real skill!
Have you considered running a mini internal hedge fund for funding? Being a self-sufficient startup off the back of your product would be a win in every way