


Prediction markets are among the most powerful forecasting mechanisms available today.1 In the 2024 US presidential election, for example, Polymarket, one of the world’s largest prediction markets, outperformed pollsters and pundits.
The majority of trading volume on Polymarket is concentrated in sports and crypto, but there are also markets on more sober themes such as geopolitics, national and regional elections, central bank decisions, technological developments, and armed conflict. One example is when traffic through the Strait of Hormuz returns to normal.
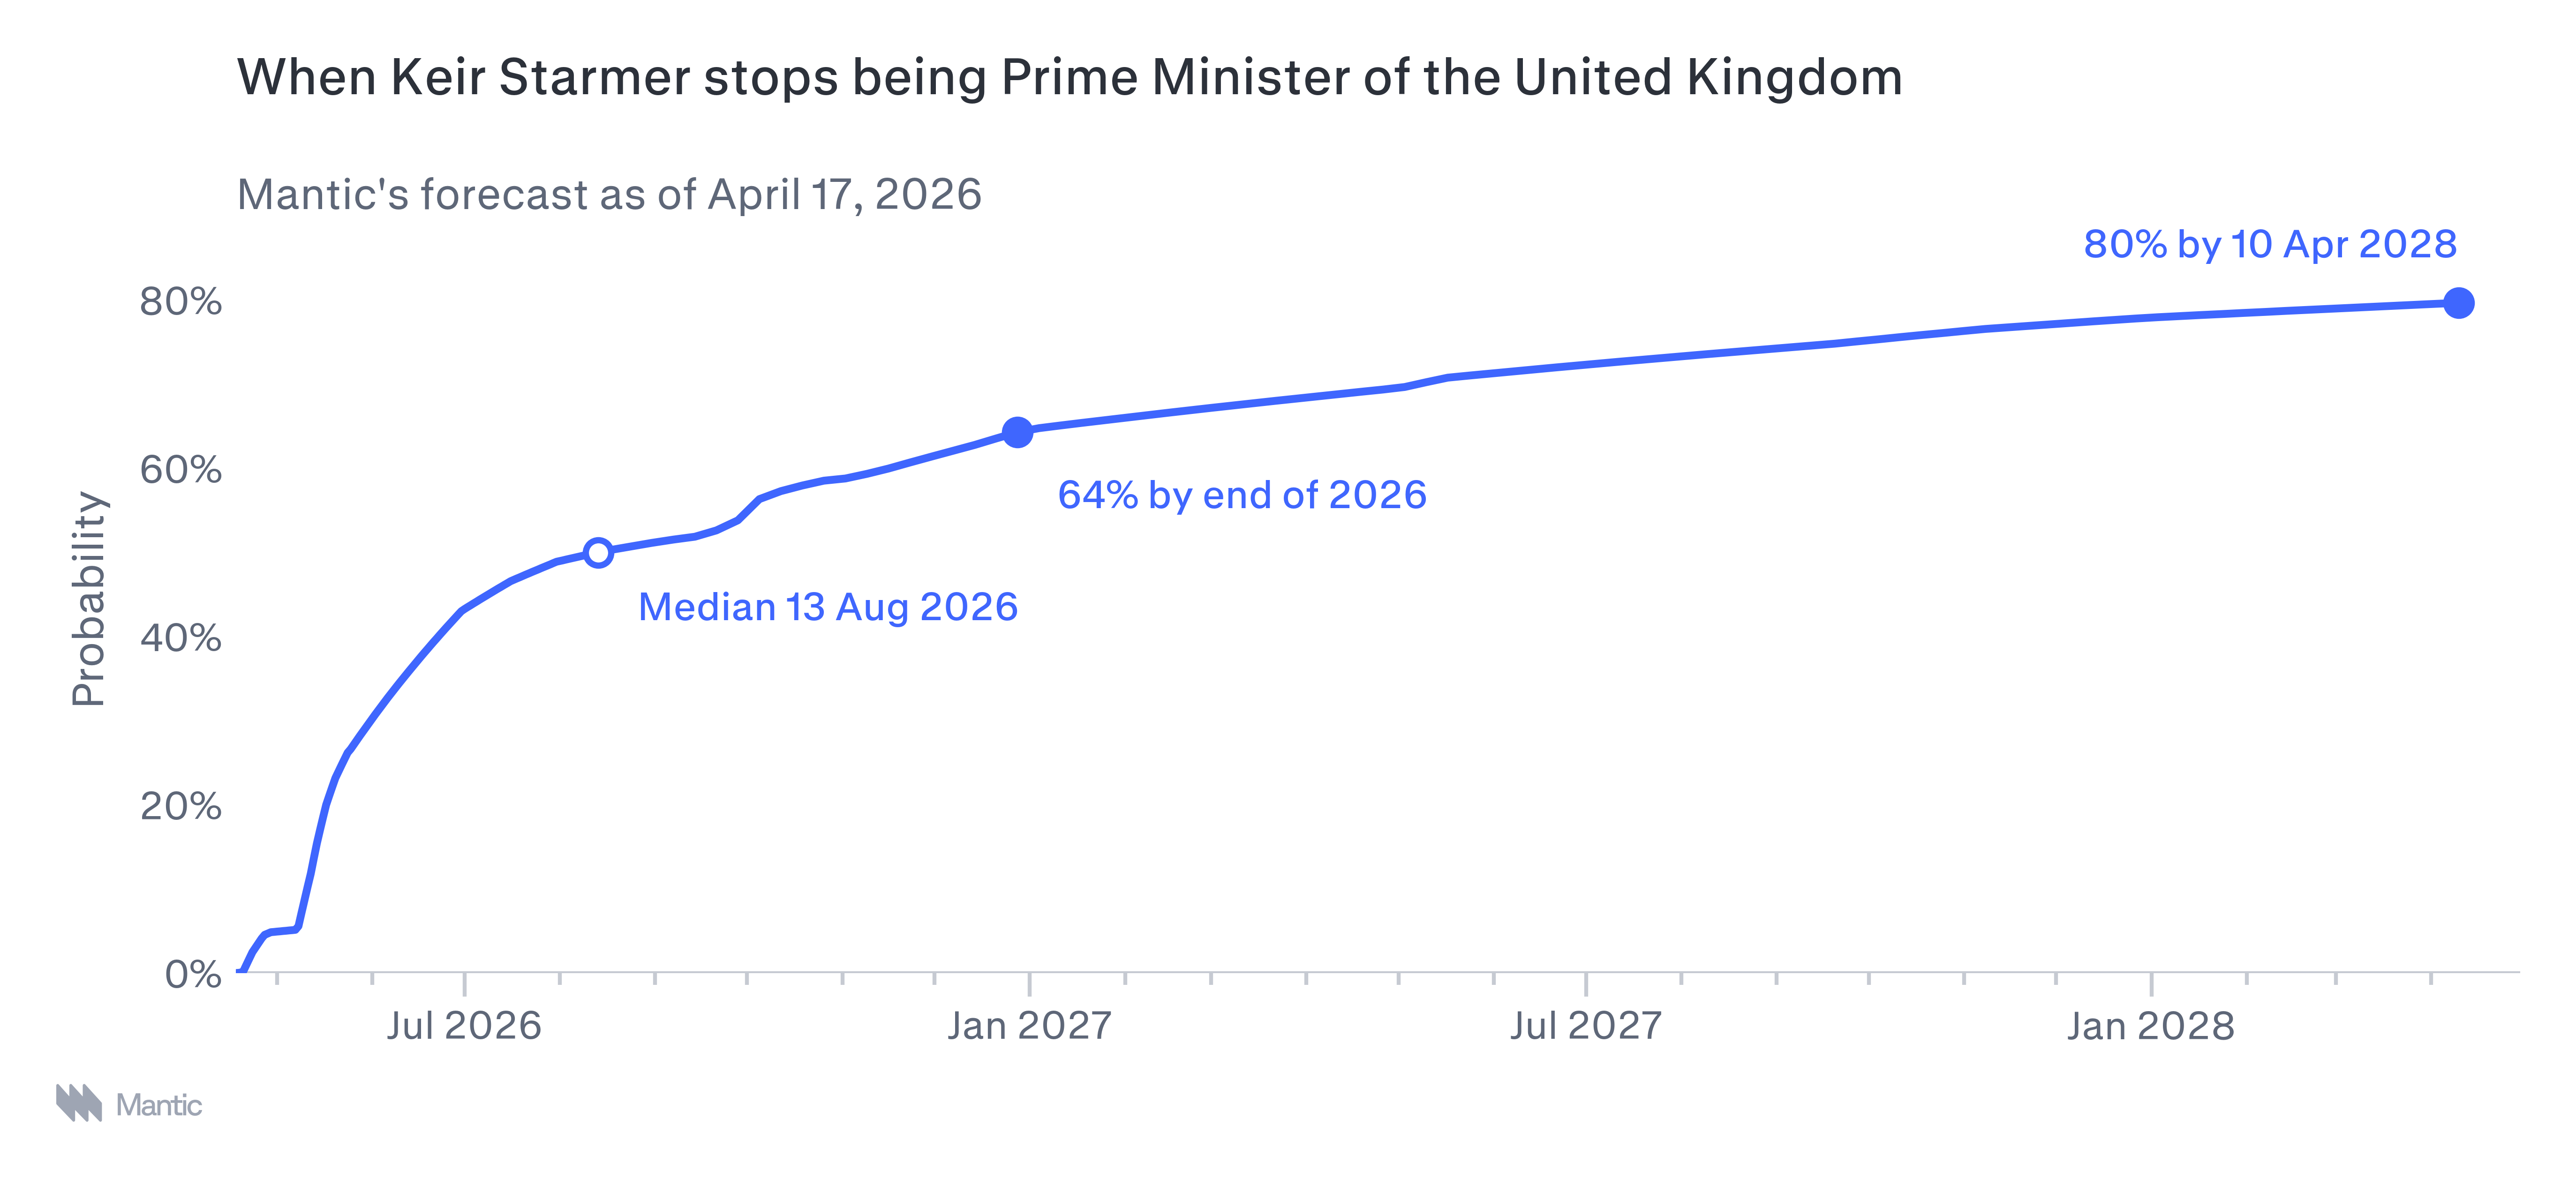
At Mantic, we have built our prediction engine to be backtestable meaning it can be run today as though it were some date in the past. For example, we can run our system as though it were April and ask ‘When will Keir Starmer stop being Prime Minister?’
The experiment
We took Polymarket prices at 10,073 observations from 4,139 markets over 817 resolved events between February and August 2026, sampling at volume snapshots set at open, $1k, $10k, $100k, $1M, and $10M volume, and ran the Mantic system to compare forecasts.2
This post includes five summary findings. Reach out for the full report.
Mantic is significantly more accurate than Polymarket up to $100k of traded volume
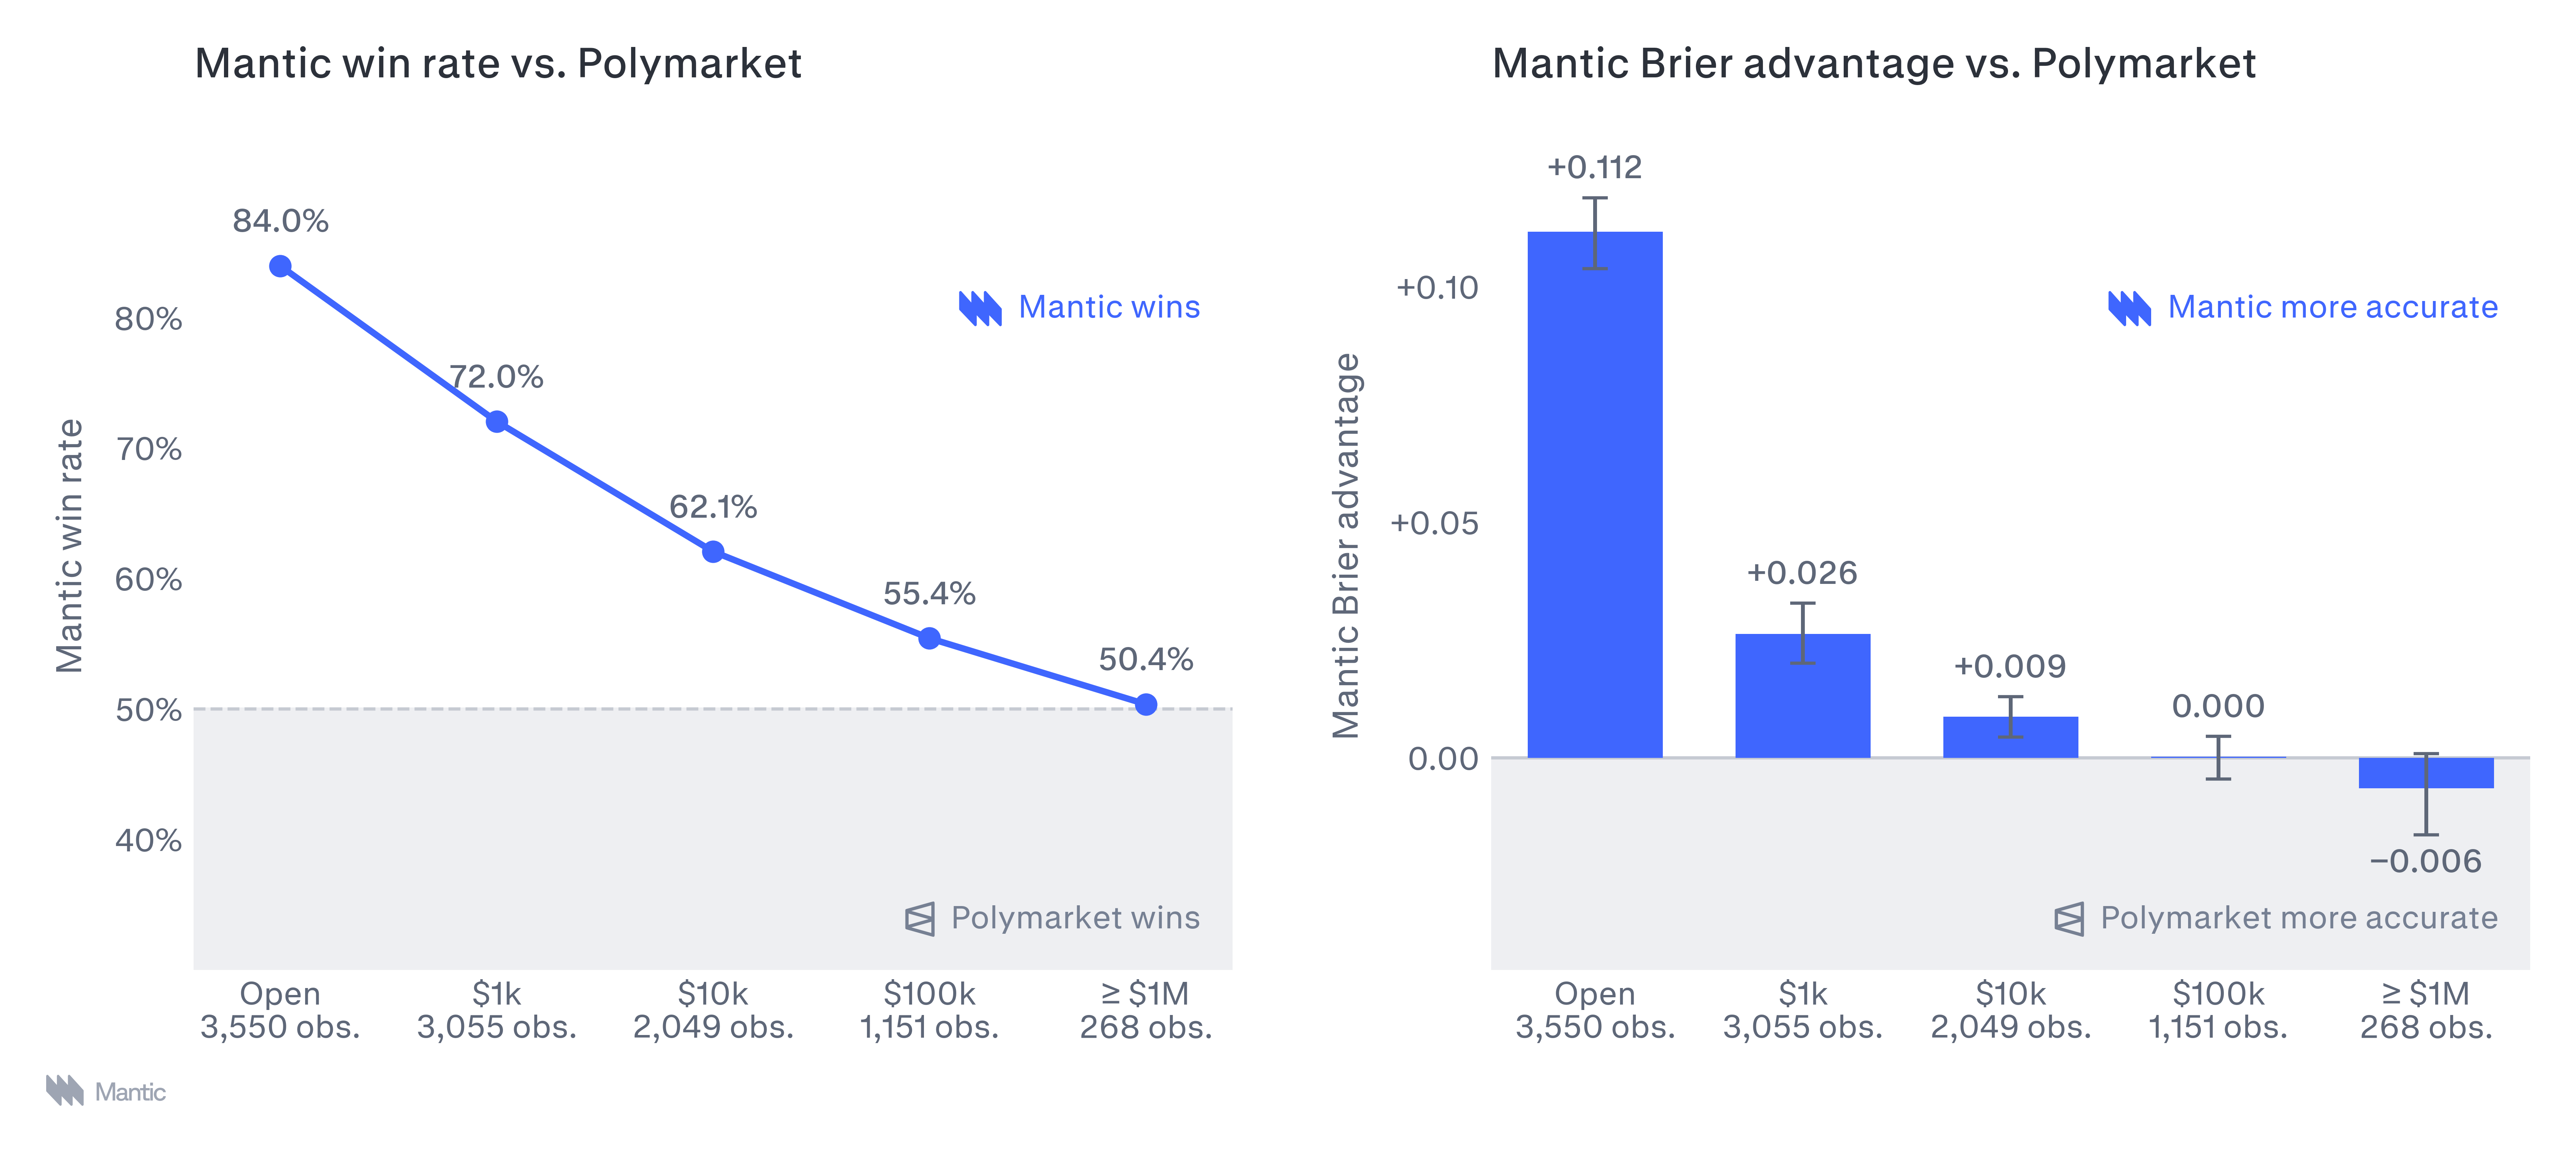
We are significantly more accurate3 than Polymarket until a question reaches $100k of traded volume across its markets. At open, we’re closer to the outcome on 84% of markets; our win rate is still 72% at $1k and 62% at $10k. There is not a significant difference in accuracy from $100k but our win rate stays above 50%.
Mantic is better calibrated
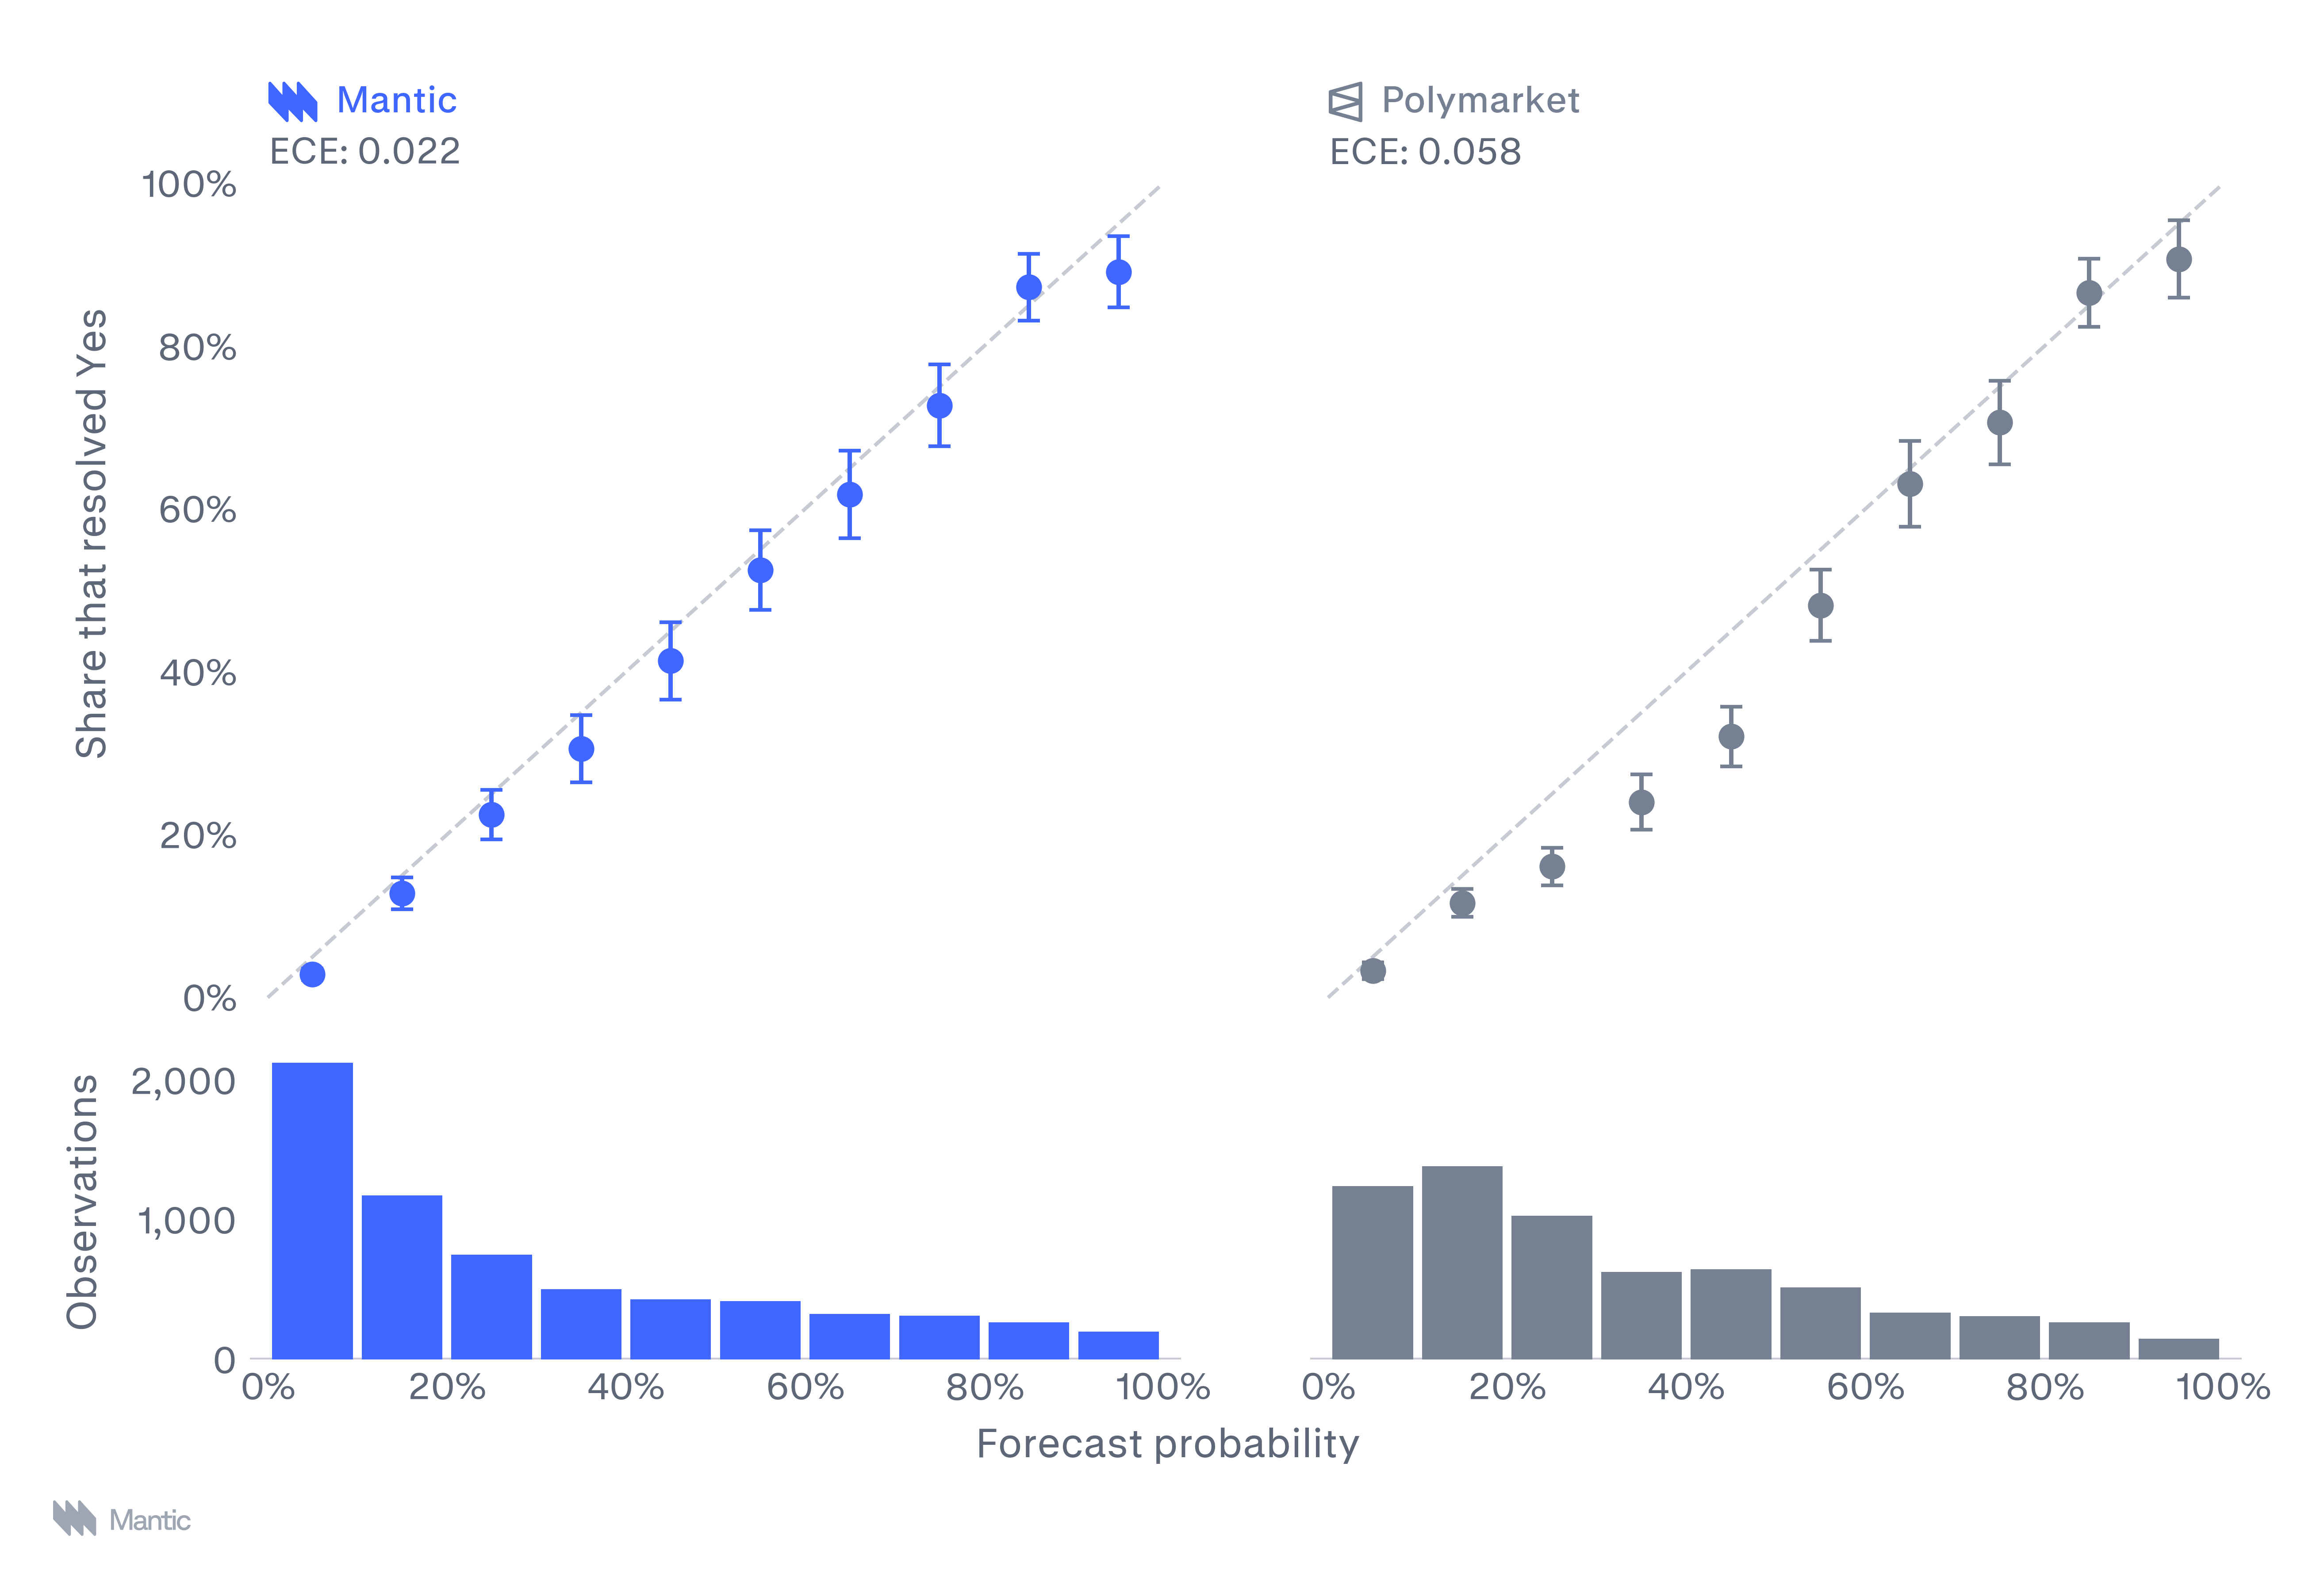
Calibration measures how well a forecaster’s odds actually match up with how often things happen.4 We’re significantly better calibrated than Polymarket over questions with at least $1k traded across their markets, with an expected calibration error5 (ECE) of 0.022 against Polymarket’s 0.058, where lower is better.
Mantic’s edge is largest where price discovery is limited, and grows when it disagrees with the market
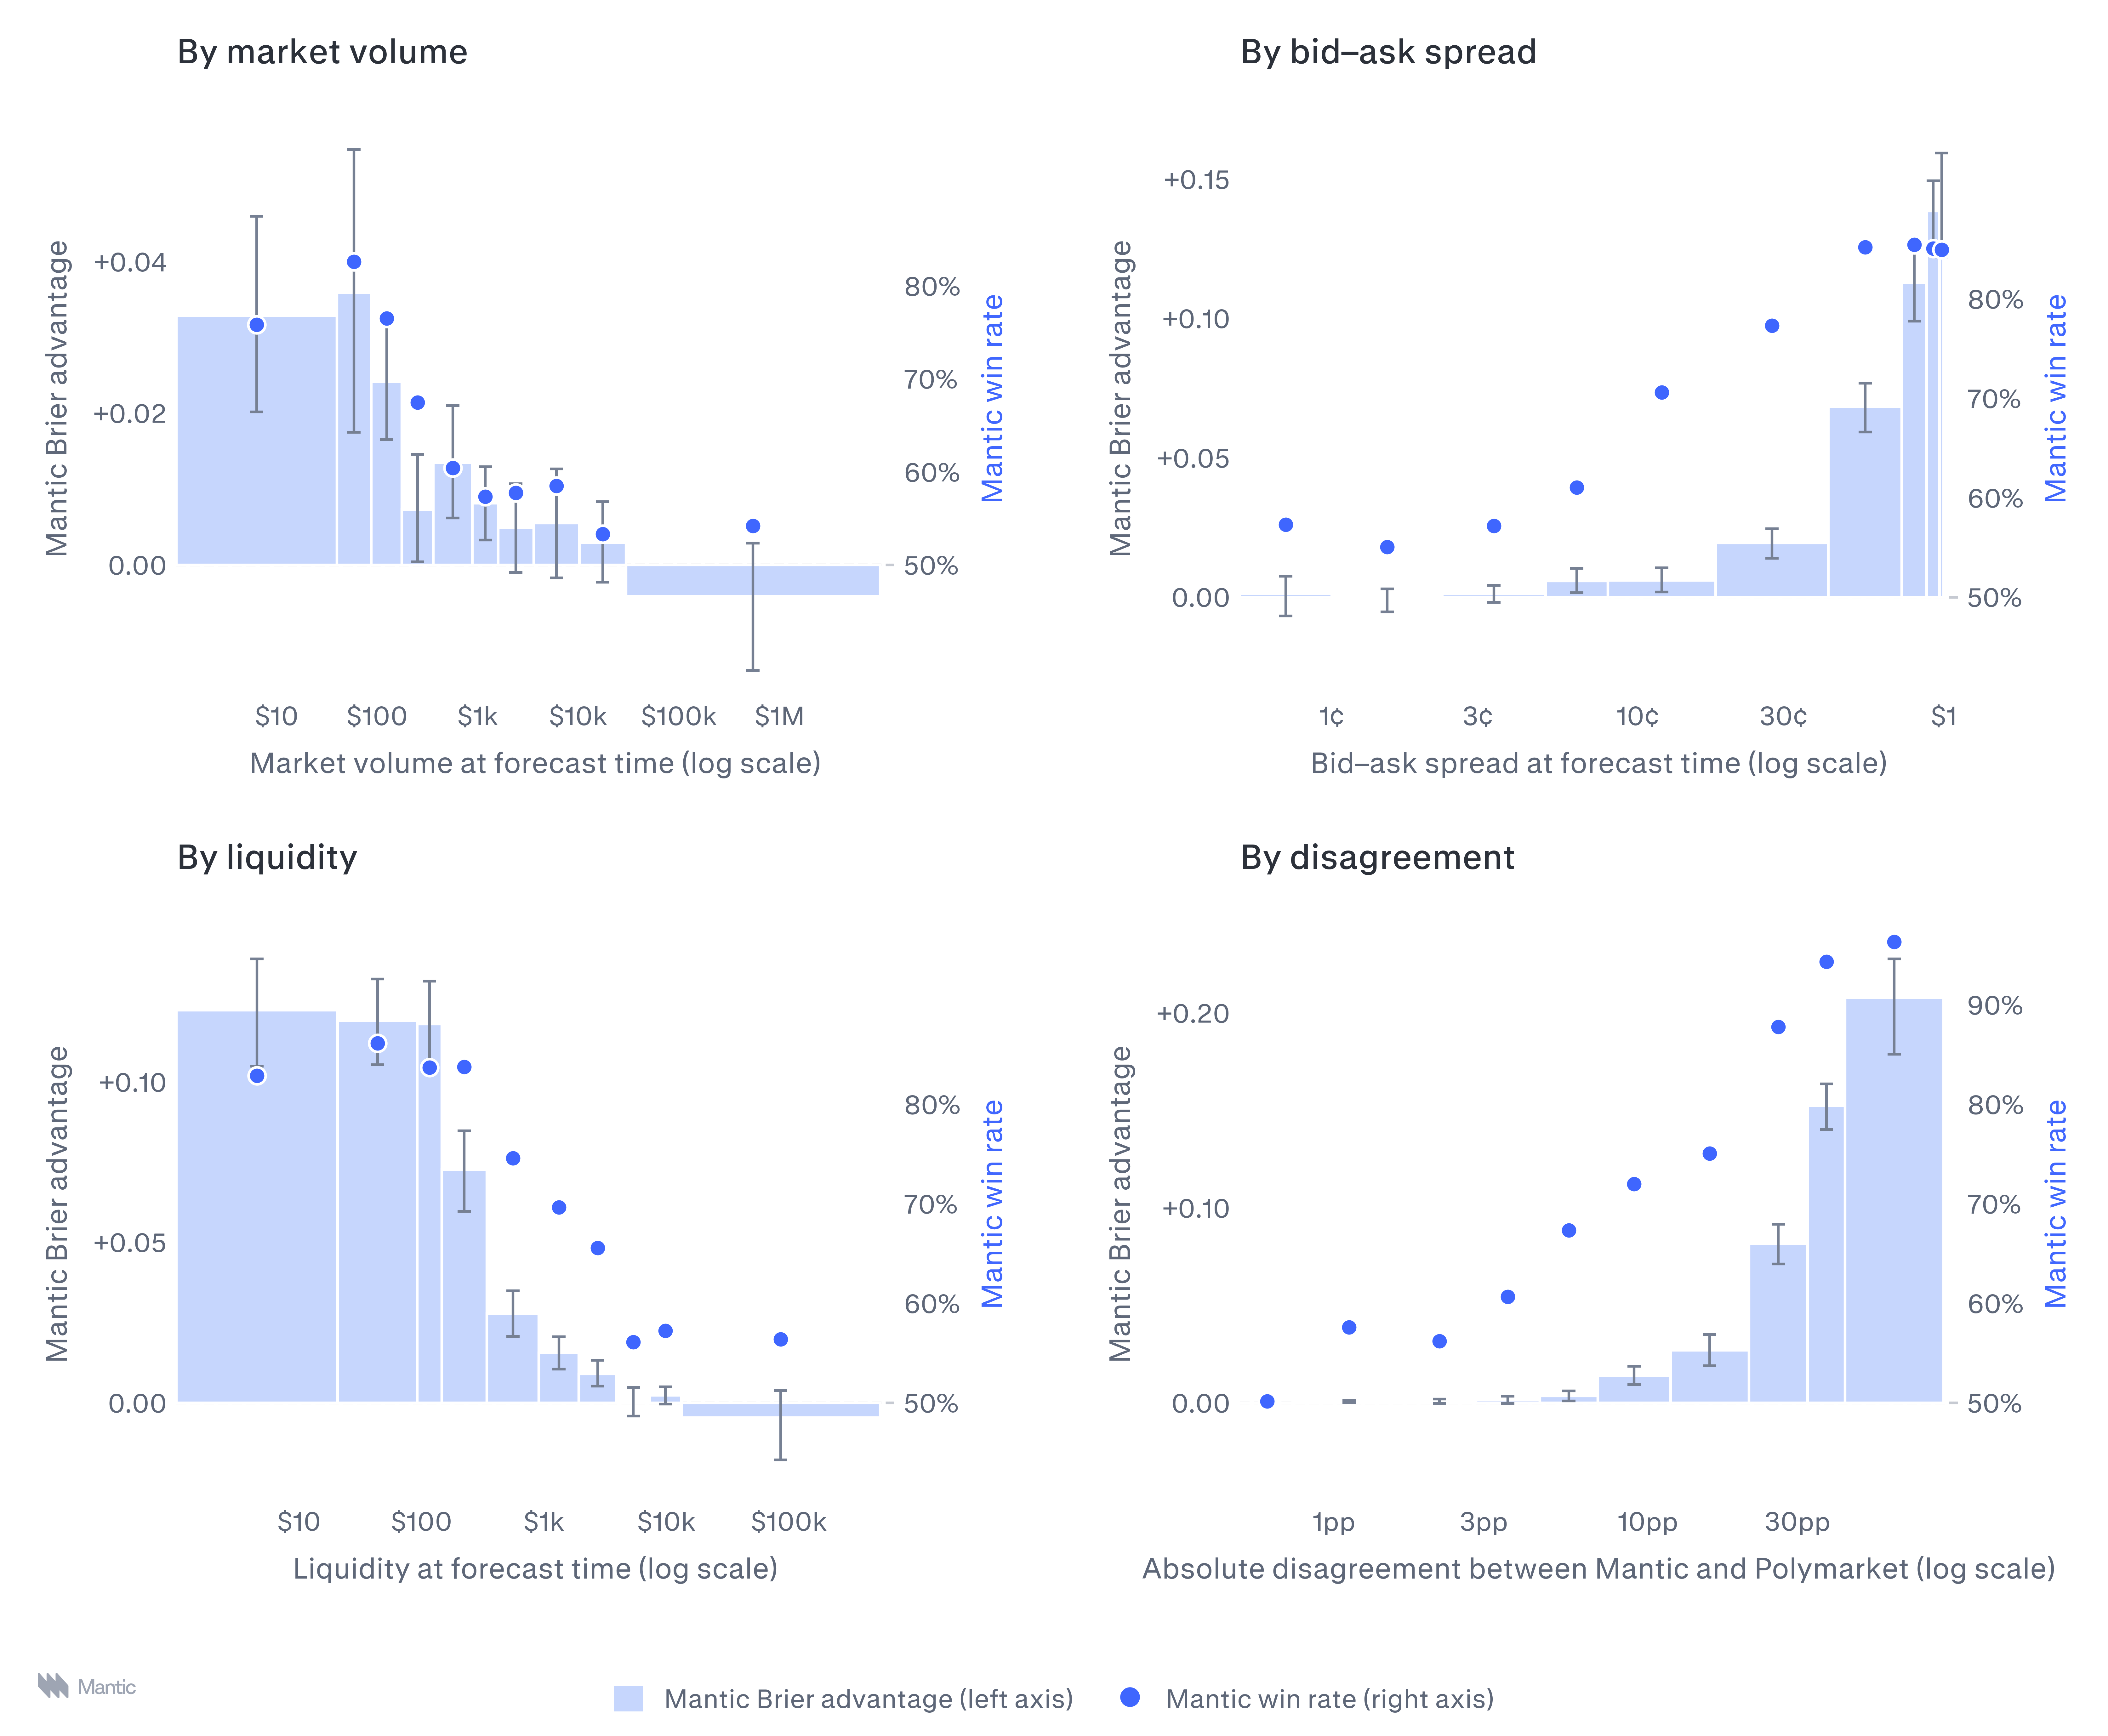
Our advantage is strongest for markets with lower volume (top left), lower liquidity (bottom left), and higher bid-ask spread (top right), i.e. where price discovery is limited. We also find the more we disagree, the bigger our advantage (bottom right).
Taking positions in the direction of Mantic’s disagreement yields positive payoffs
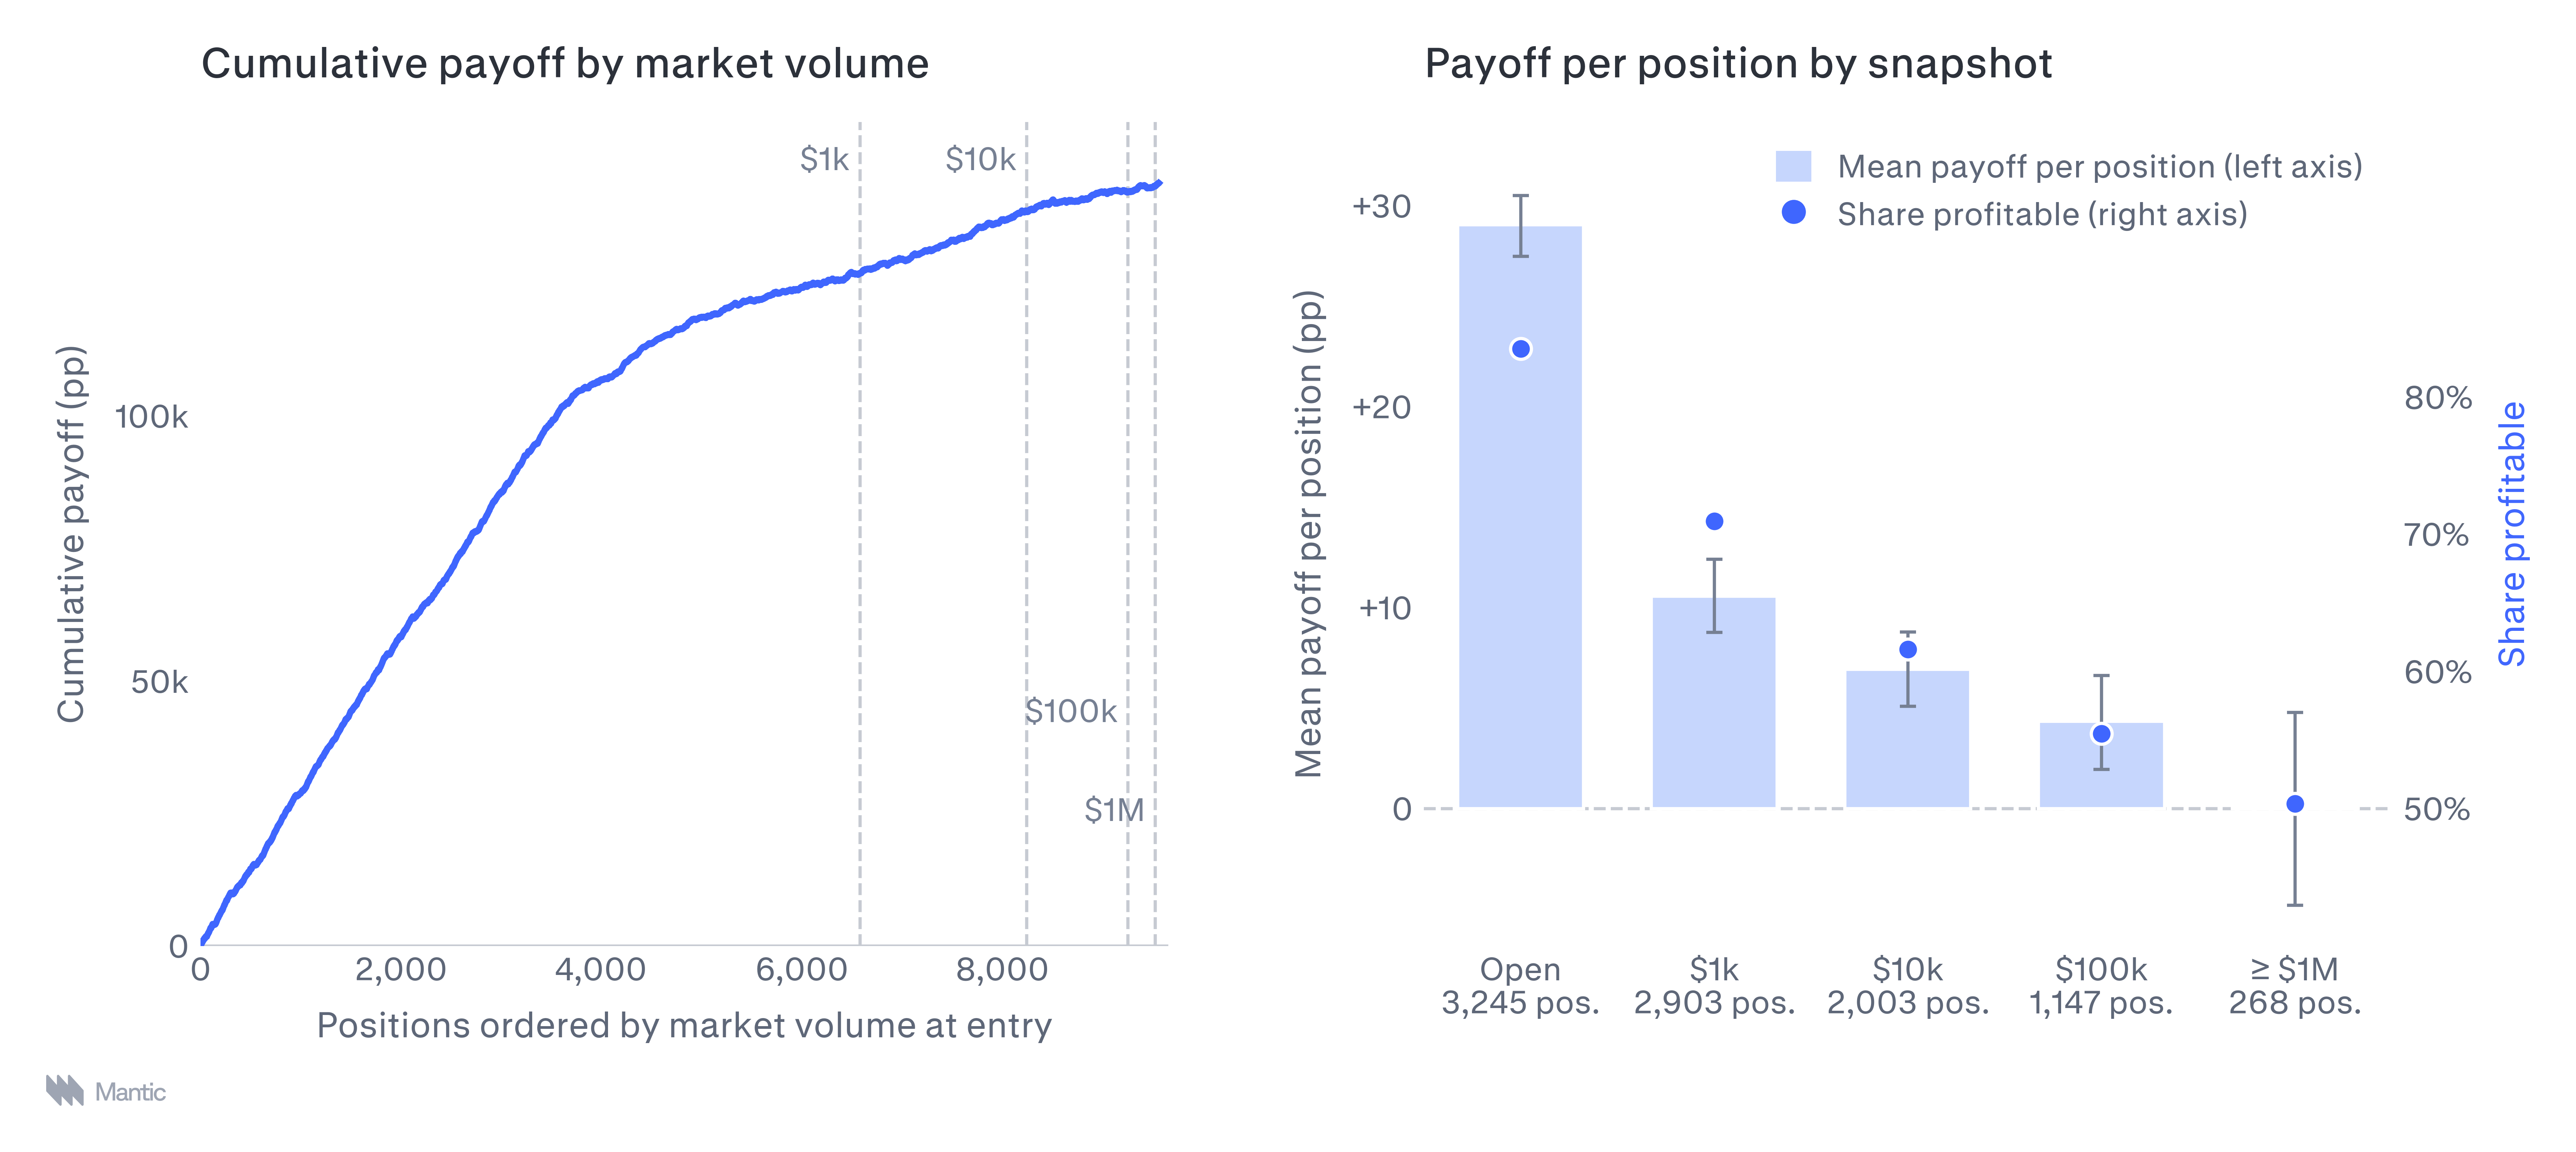
Taking a one-share position in the direction of our disagreement and holding until resolution yields +15 percentage points (pp) on average at market prices, or +3.8 pp when limited only to disagreements outside the spread and entering at the bid or ask. Ordered by market volume (left), the cumulative payoff rises at every volume level. By snapshot (right), the payoff is significantly positive through the $100k snapshot.6
Mantic’s forecasts are diversifying to market prices even when its accuracy advantage is no longer significant
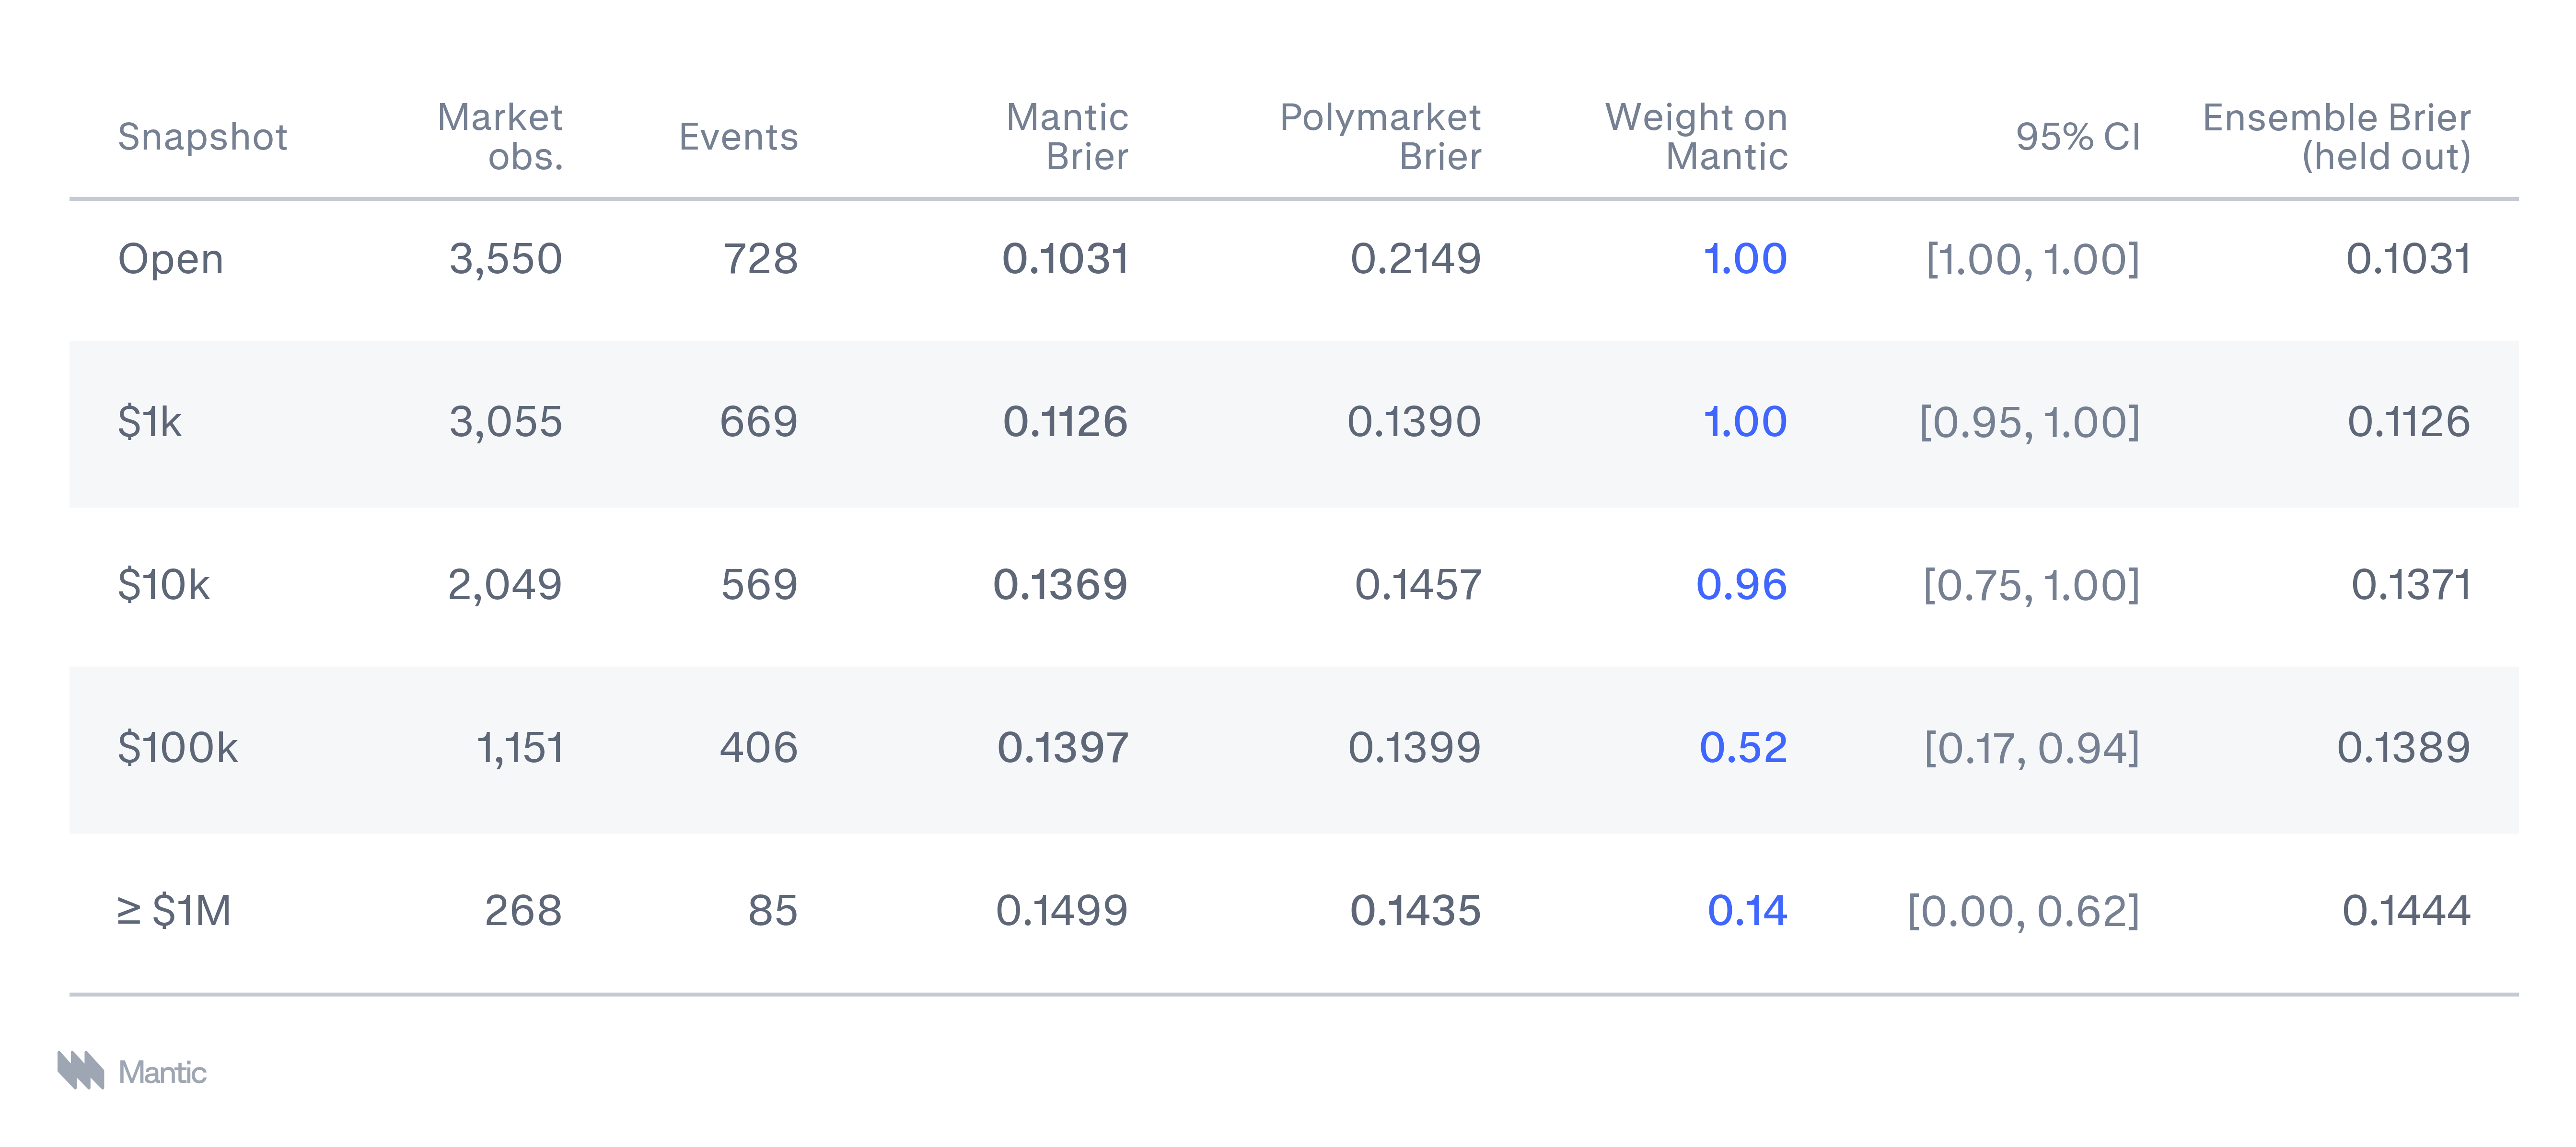
What happens if we combine the two? We can mix our forecasts in an ensemble that weights the Mantic prediction with the Polymarket price, choosing the weight that gives the best accuracy.7 At open and $1k, the best ensemble ignores the Polymarket price entirely, and at $10k it puts 96% of the weight on Mantic. At $100k, where the two are equally accurate on their own, the weight splits roughly evenly and the ensemble beats both on held-out events.
A prediction market is an exchange where traders buy and sell contracts that pay out depending on whether real-world events occur. Consider a contract that pays out $1 if some event happens this weekend. How much would you pay for it? If you think the event has a 30% chance of happening, you’d be willing to pay up to 30¢. The market price, set by many traders, can therefore be read as a collective probability estimate.
Our forecaster sees the Polymarket price as part of its research, along with market data such as traded volume and liquidity, just as it would see any other source. As with everything in a backtest, it only sees them as they stood at the moment of the forecast. It treats the price as evidence and it’s free to disagree. The results show that when Mantic disagrees, it is often right.
Accuracy is measured using the Brier score. For binary predictions, like those on Polymarket, the Brier score is equivalent to the mean squared error. This is a proper scoring rule, meaning that you expect to maximise your score by faithfully reporting your probability estimate i.e. if you think something has a 10% chance of happening, you expect to score highest by saying 10% and not 5% or 20% etc.
The likelihood a forecaster gives to some event is their forecast probability. The rate at which things actually happen is the empirical probability. For a well-calibrated forecaster, over many events we expect these numbers to be the same; in the aggregate, things happen as often as they think they will. So, if they gave a forecast of 30% to 100 independent events, we’d expect to see about 30 of those events actually happen.
The expected calibration error is calculated by taking many resolved forecasts, binning them into groups along the number line, finding the difference between the empirical probability and the forecast probability for the group, and averaging these across the bins. In terms of the plots above, this is how much the points stray from the identity at 45 degrees. A lower score is better and perfect calibration produces a score of 0.
This is a scoring exercise, not a trading simulation: it doesn't account for position sizing, market impact or fees.
The ensemble forecast is w × Mantic + (1 − w) × Polymarket, with w between 0 and 1 chosen to minimise the Brier score. We score it on held-out events: each event is scored using a weight fitted on all the other events.