

Friday Forecasts is a weekly series showcasing five curated forecasts directly from Mantic.
1. US beef-price inflation in June 2027 ↗
US retail beef rebounded 0.9% in October, seasonally adjusted, despite falling cattle futures. Low import-quota uptake shows why extra market access need not mean more imports or cheaper beef. Explore on Mantic ↗
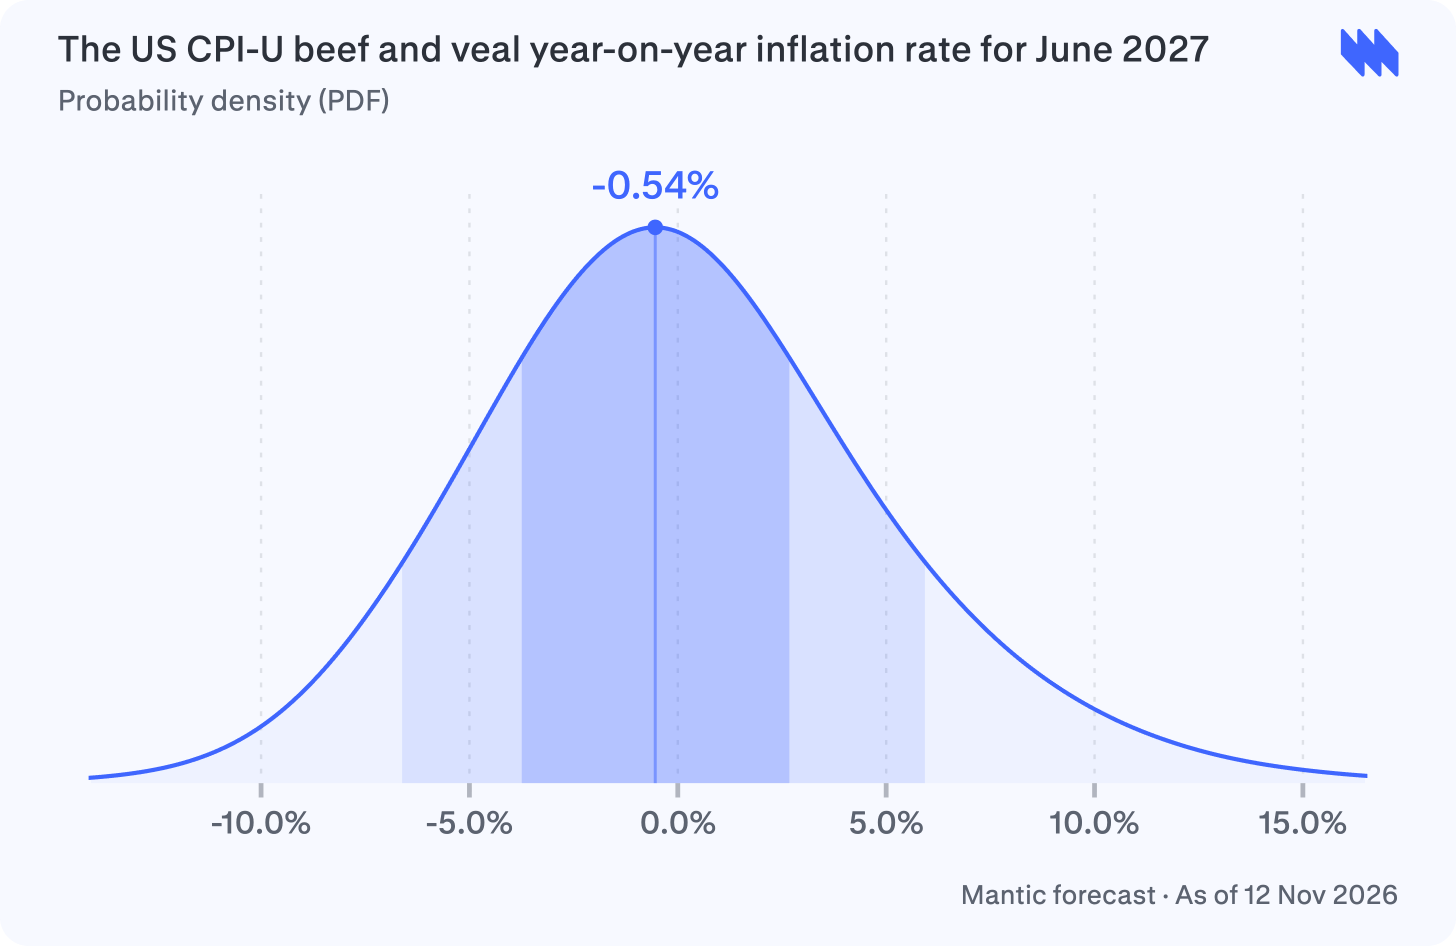
I give a 50% probability that US CPI-U beef and veal year-on-year inflation for June 2027 is between −3.7% and 2.7%, with −0.5% the most likely value.
I anchor on October 2026 prices, about 1.9% below June after seasonal adjustment in BLS data. That starting gap pulls my forecast below zero.1
I allow retail prices to fall as cheaper cattle feed through from CME markets. September’s roughly 50% increase in beef imports also supports my case for falling prices.2
I temper the downside after October’s 0.9% seasonally adjusted retail-price rebound. USDA’s lower 2027 production forecast and expiring extra import access also support a renewed price rise.3
I keep my range wide because historical monthly retail-price changes tend to persist, allowing shocks to accumulate. Uncertainty over whether imports offset tighter cattle supplies widens it further.
What if the US keeps extra beef-import access open? ↗
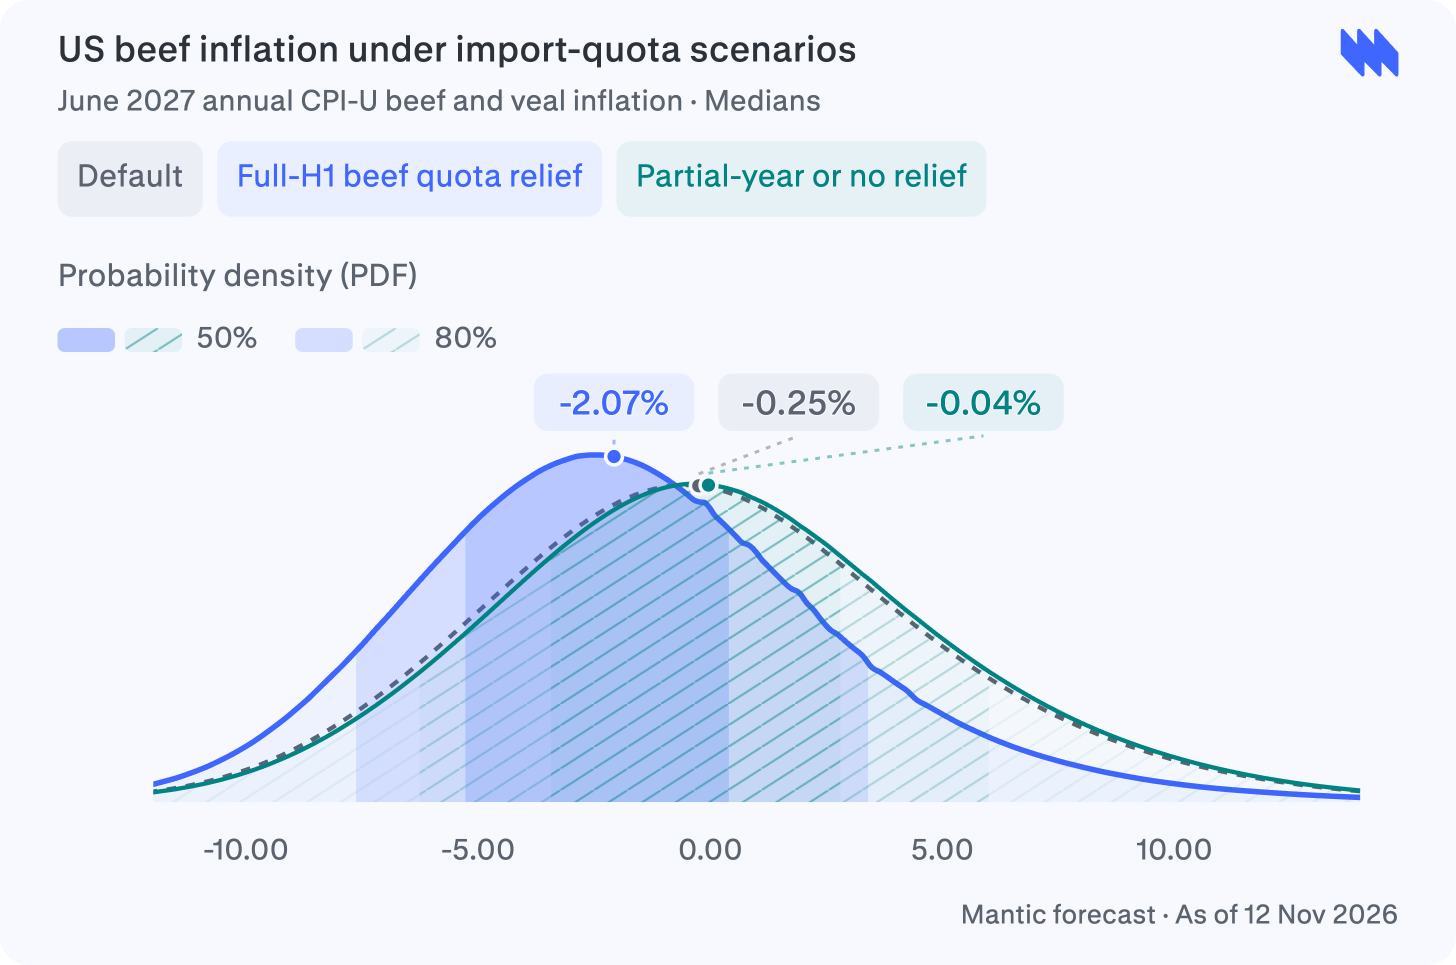
At least 150,000 extra tonnes of quota throughout H1 2027
Without the assumption, the expanded 2026 lean-trim import quota was scheduled to expire at the end of November. Guaranteed relief throughout the first half of 2027 overrides that expiration and ensures continuing import access.4
China’s 55% tariff on Brazilian beef makes it likely that tariff-free US quota relief will attract substantial lean beef, putting further downward pressure on ground beef.
Live cattle futures fell from around $252 in June 2026 to about $219 in November. The assumption strengthens the pass-through of those lower wholesale prices to retail.5
Domestic supply tightness limits the decline. The USDA reduced projected 2027 beef production by 155 million pounds, and feedlot placements fell 12% in September.6
Partial-year or no material additional relief
The absence of extra quota relief removes the downward price pressure from expanded imports, leaving domestic supply constraints to dominate.
Domestic supply constraints push prices higher. The USDA reduced projected 2027 beef production by 155 million pounds and forecast 2027 beef prices to rise 2.4% as September placements fell 12%.7
The upward move is small because temporary 2026 quota tranches filled only 30% to 37%. Withholding additional quota therefore deprives the market of relatively little actual supply.8
Wholesale cattle weakness also checks the rise. Live cattle futures fell from about $252 in June 2026 to around $217 to $219 in November, while October retail prices remained below June 2026 levels.9
2. Brazil’s share of China’s soybean imports in 2027 ↗
China has promised US soybean purchases, but an extra 10% tariff still deters private crushers. State buyers can honour the deal while commercial demand stays with Brazil. Explore on Mantic ↗
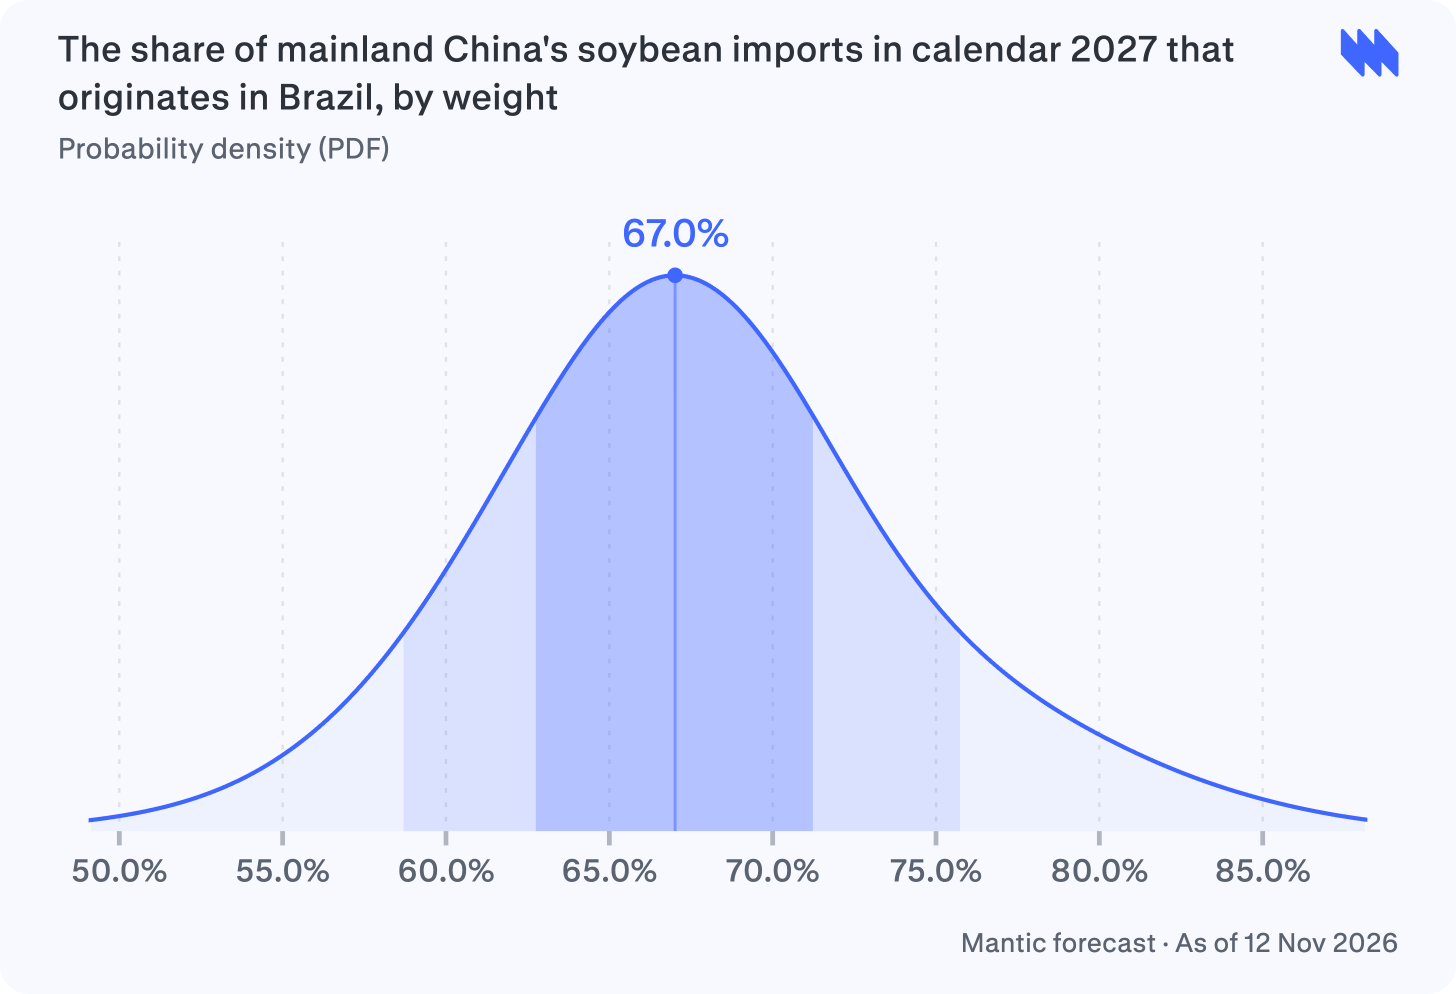
I give a 50% probability that Brazil supplies 62.8–71.2% of mainland China’s soybean imports by weight in 2027, with 67% the most likely share.
The US Department of Agriculture reported 15.1 million tonnes of US soybeans booked by 22 October. My central assumption is 24–25 million tonnes arriving in 2027, reducing Brazil’s share.10
I treat China’s extra 10% tariff on US soybeans as limiting private purchases. Tariff relief reduces Brazil’s share; renewed trade disruption raises it.11
China’s agriculture ministry puts 2026/27 imports at 95.5 million tonnes, versus the US Department of Agriculture’s 115 million. I allow weaker demand to squeeze Brazil’s share after state US purchases.12
Brazilian production forecasts span 178–186 million tonnes despite El Niño risks. I favour ordinary crop conditions, but allow losses to shift Chinese purchases towards competing suppliers.13
3. Indonesia’s domestic biodiesel distribution in 2027 ↗
Indonesia’s 50% biodiesel mandate pits fuel demand against food and export buyers for palm oil. Funding shortages and refinery limits could keep actual purchases below what the mandate suggests. Explore on Mantic ↗
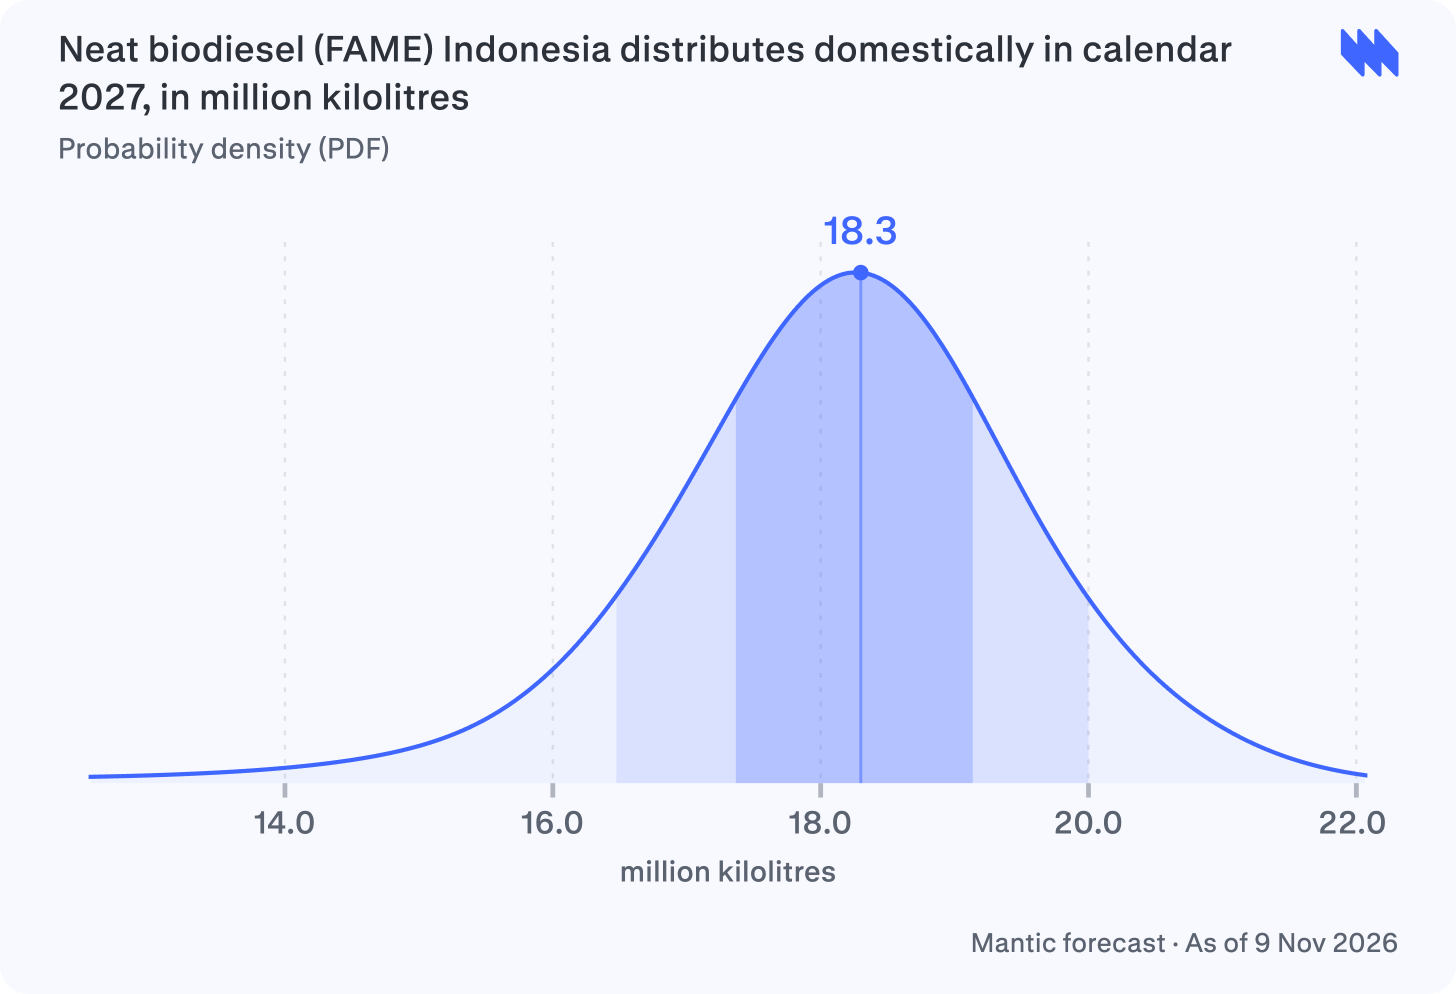
I give a 50% probability that Indonesia distributes 17.4–19.1 million kilolitres of neat FAME biodiesel domestically in 2027, with 18.3 million kilolitres the most likely value.
Indonesia distributed 3.42 million kilolitres of FAME under its 50% blend mandate from July to 7 September 2026. I annualise that pace to anchor full-year demand around 18–19 million kilolitres.14
My main uncertainty is coverage: Bahlil includes non-subsidised diesel in the 50% blend. A sector roadmap retains 40% there in 2027, so I allow for narrower implementation.15
I constrain higher outcomes because practical output is only 80–85% of installed capacity. I also limit the proposed 60% blend’s uplift because it may add non-FAME renewable diesel instead.16
US Department of Agriculture figures show a shrinking palm-oil subsidy fund, and November reporting describes feedstock shortages and tax-refund delays. I allow these pressures to reduce distribution.17
4. The price of urea in the second quarter of 2027 ↗
Urea is back near $420 a tonne after April’s $857 spike. Extra Chinese supply has eased the squeeze, but Gulf disruption still leaves farmers exposed before spring planting. Explore on Mantic ↗
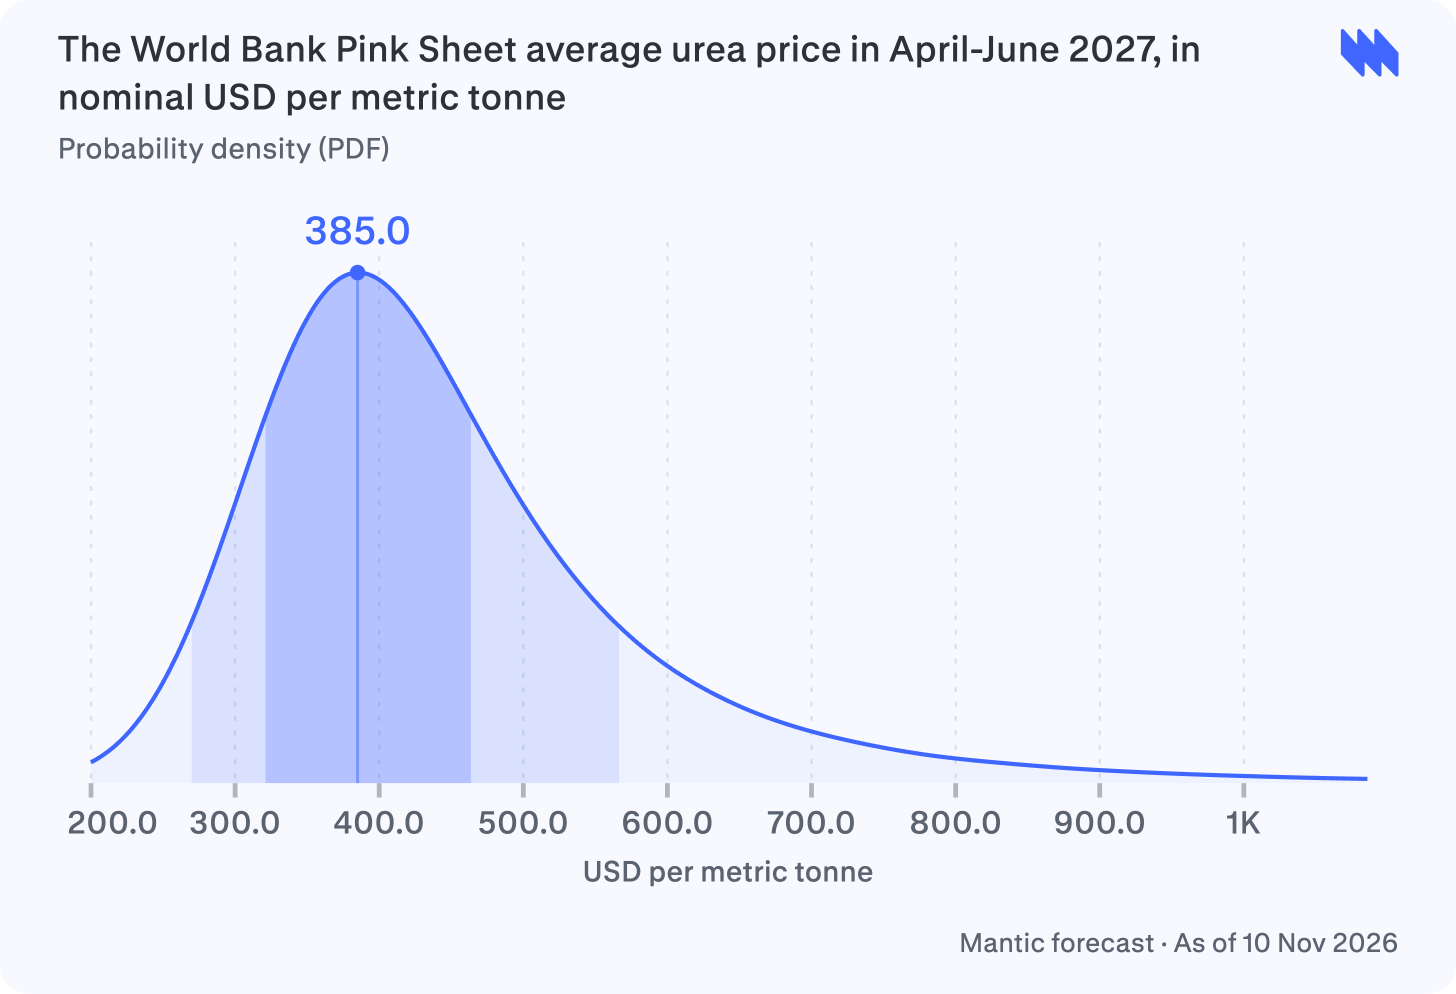
I give a 50% probability that the April–June 2027 World Bank Pink Sheet average urea price is $321–$464 per metric tonne in nominal US dollars, with $385 most likely.
I anchor near October 2026’s $420 per tonne, not April’s $857 peak. I use the World Bank’s $429 annual 2027 forecast only as a level check.18
The World Bank attributes the retreat to increased Chinese exports, other suppliers and reduced seasonal buying. I treat that supply response as support for further price easing.19
My main uncertainty is whether prolonged Hormuz closure outweighs alternative supply. I retain higher-price outcomes because Reuters-based reports describe Hormuz as effectively closed and talks as stalled.20
Historical October-to-following-April–June price changes were large, so I keep my range wide. World Bank warnings about conflict and export restrictions lead me to allow sharper rises than falls.21
5. Ghana’s cocoa export receipts in 2027 ↗
Ghana’s cocoa regulator raised GHS3.39bn against GHS4bn sought for bean purchases. A funding gap can delay exports even when beans are available, weakening the link between harvests and dollar earnings. Explore on Mantic ↗
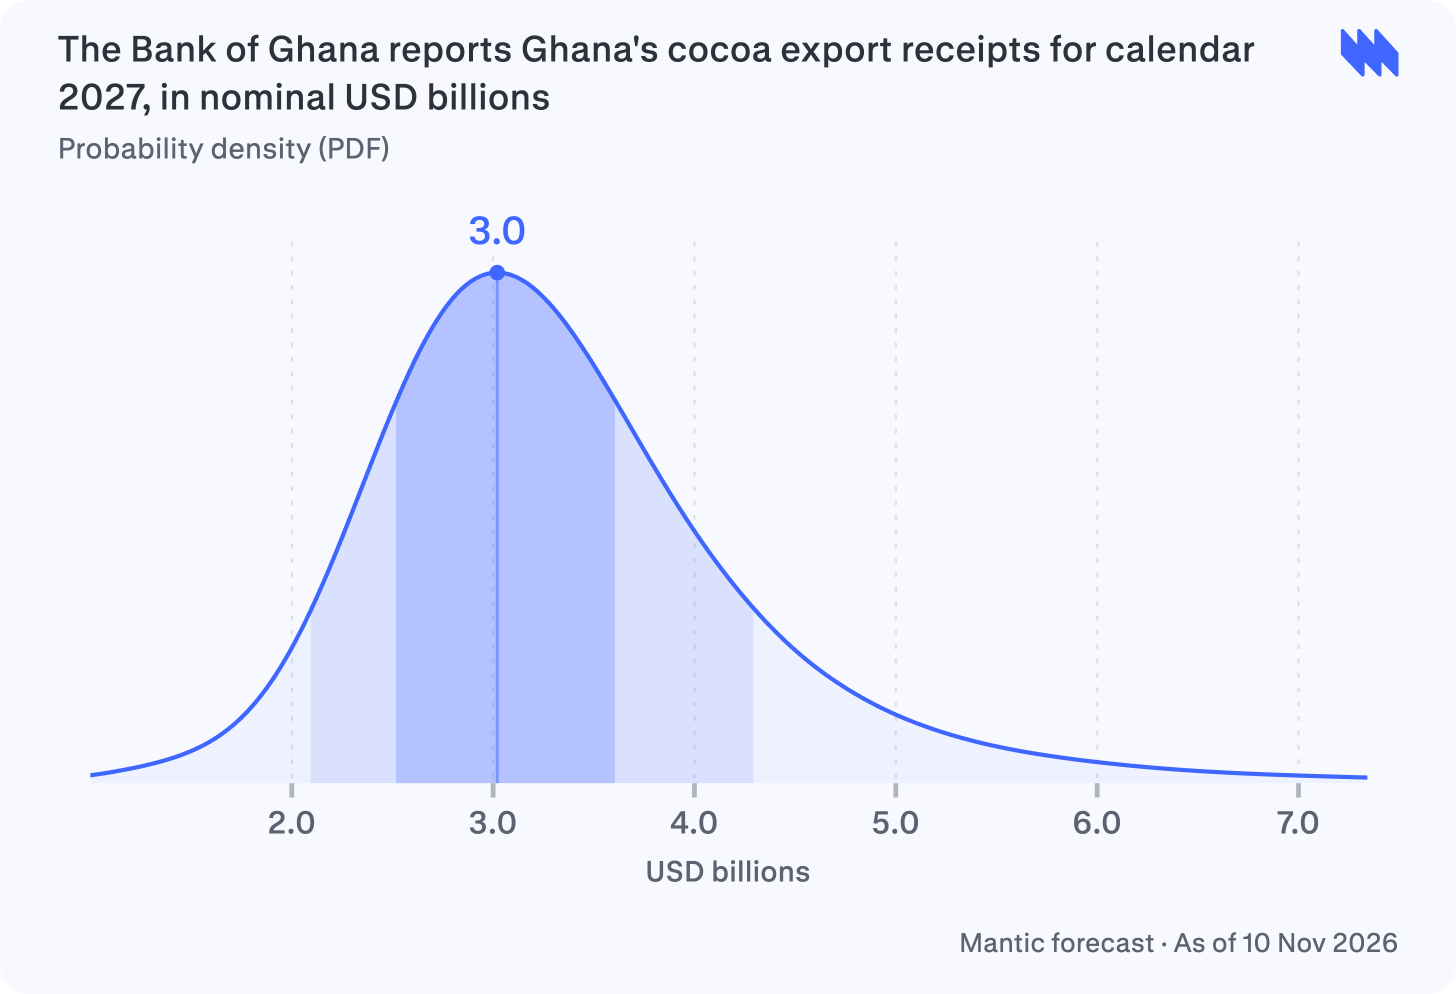
I give a 50% probability that the Bank of Ghana initially reports 2027 cocoa export receipts between US$2.5 billion and US$3.6 billion, with US$3.0 billion most likely.
CMC expects Ghana’s 2026/27 crop to fall to 470,000–620,000 tonnes from roughly 770,000. I therefore forecast receipts below the Bank of Ghana’s US$4.0 billion total for 2025.22
I anchor realised export prices near US$5,100 per tonne using COCOBOD’s producer-price announcement. That is below the US$7,200 assumption at the start of 2025/26, so I lower receipts.23
I allow higher prices to offset some lost volume because regional shortages affect both. The World Bank’s October 2026 outlook forecasts US$5,400 per tonne for 2027.24
COCOBOD’s first domestic funding issue raised GHS3.39 billion against GHS4 billion sought. I allow financing delays both to shift exports into 2027 and to prevent some shipments.25
From cocoa receipts to the cedi ↗
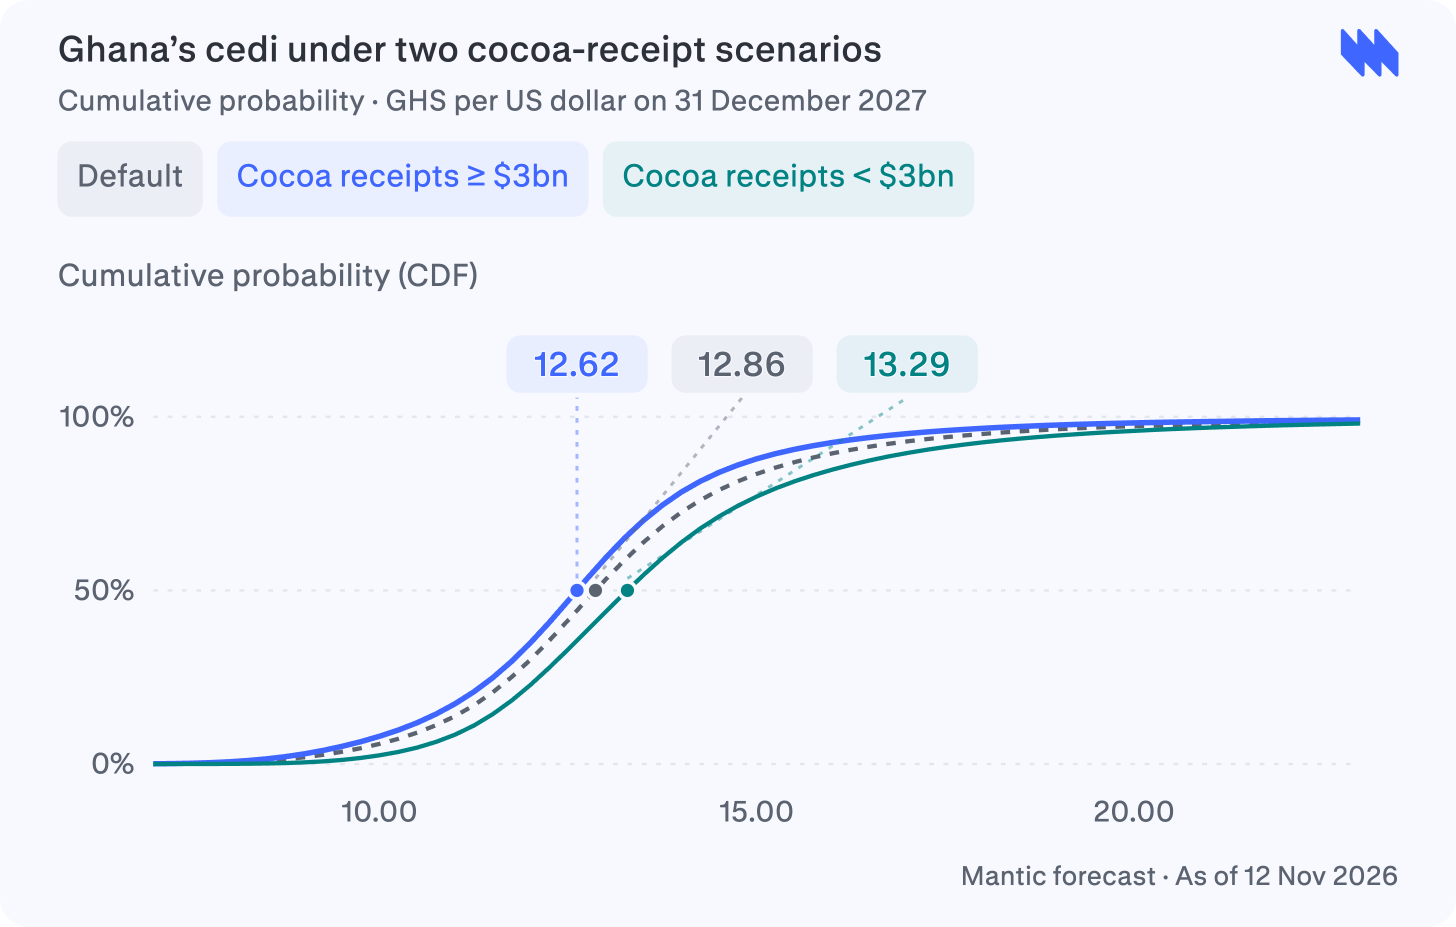
Ghana cocoa export receipts ≥ $3B
The cocoa harvest started poorly, with output projected to decline by 18% to 38%. Receipts of at least $3bn would add foreign-currency supply and support a stronger cedi.26
Cocoa generates much less foreign exchange than gold, which earned $14.86bn in the first eight months of 2026 against $2.71bn for cocoa. This disparity limits how much cocoa alone can move the rate.27
Rebuilt reserves and an IMF-projected 2027 current-account surplus of 5.9% of GDP reinforce stability. However, external debt service and reduced central-bank market intervention keep moderate depreciation in place.28
Ghana cocoa export receipts < $3B
With output projected to fall by 18% to 38% after a poor start to the harvest, receipts below $3bn are close to baseline expectations. The shortfall reduces dollar inflows and increases expected depreciation.29
Gold exports of $14.86bn over January to August 2026 heavily outweighed cocoa’s $2.71bn. Substantial gold earnings and a projected current-account surplus prevent the cocoa shortfall from causing an external financing crisis.30
Without higher cocoa receipts to buffer external payments, rising debt service and the priority to rebuild foreign reserves sustain upward drift in the exchange rate.
Cattle, CME Live Choice Average, Future, Live Choice Average, 1st Position, Close, USD. Macrobond.
Cattle, CME Live Choice Average, Future, Live Choice Average, 1st Position, Close, USD. Macrobond.
Cattle, CME Live Choice Average, Future, Live Choice Average, 2nd Quarterly Position, Close, USD. Macrobond.
Cattle, CME Live Choice Average, Future, Live Choice Average, 1st Position, Close, USD. Macrobond.
Cattle, CME Live Choice Average, Future, Live Choice Average, 2nd Quarterly Position, Close, USD. Macrobond.
United States, Consumer Price Index, All Urban Consumers, U.S. City Average, Food & Beverages, Food at Home, Beef & Veal, Index. Macrobond.