

Friday Forecasts is a weekly series showcasing curated forecasts directly from Mantic.
1. The Monday after launch, measured in sick leave ↗
Remote logged 32% more booked leave for launch day than a year earlier, against a typical 5% rise. How many Monday’s sick calls will managers have to deal with?1 Explore on Mantic ↗
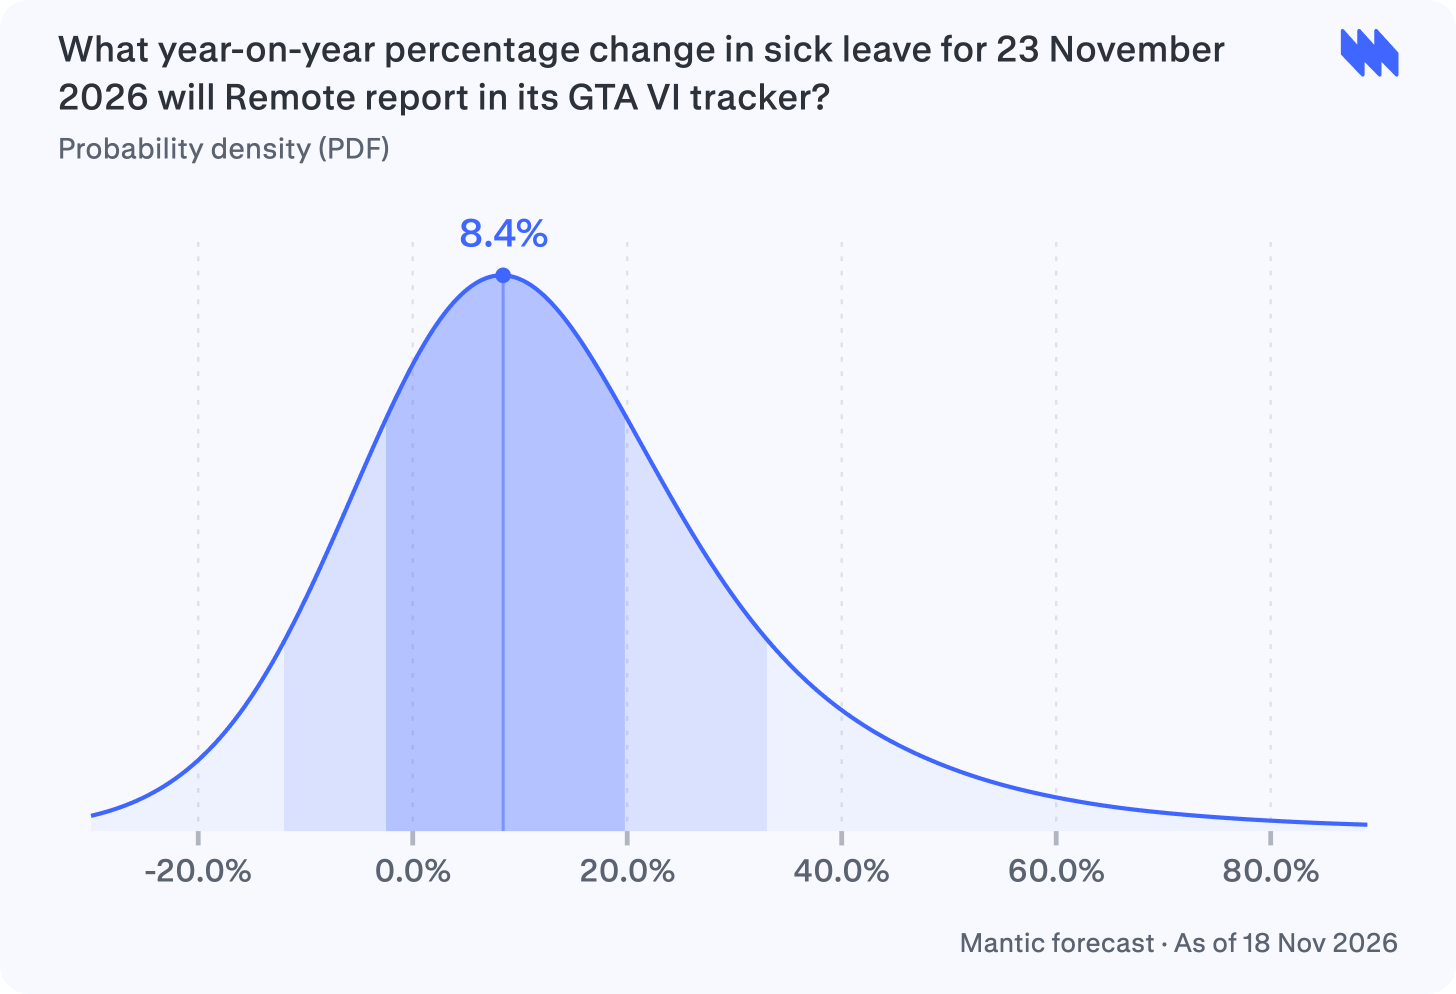
I give a 50% probability that Remote’s first-reported global year-on-year sick-leave change for 23 November 2026 is between −2.5% and +19.8%, with +8.4% the most likely value.
Remote reports typical-day planned leave up 5%, but provides no numerical sick-leave baseline. I use this only as a weak guide to underlying sick-leave growth.2
Remote’s Monday planned leave is up 7%, versus 5% on a typical day and 32% on launch Thursday. I therefore restrain my expected Monday gaming effect.3
BambooHR found that 50% of gamers planning release-related time off intended to call in sick. I allow larger increases, but do not treat these intentions as observed Monday absences.4
Without a published sick-leave sample size or first-release error history, I keep my range wide. Ordinary sickness and filing differences can outweigh extra gaming absences and produce a decline.
2. Netflix’s Thanksgiving viewing, year over year ↗
Netflix’s global Top 10 drew 935m hours over Thanksgiving week in 2025, up from 761m the week before. The 2021–25 averages were 657m hours the week before and 777m during Thanksgiving week.5 Explore on Mantic ↗
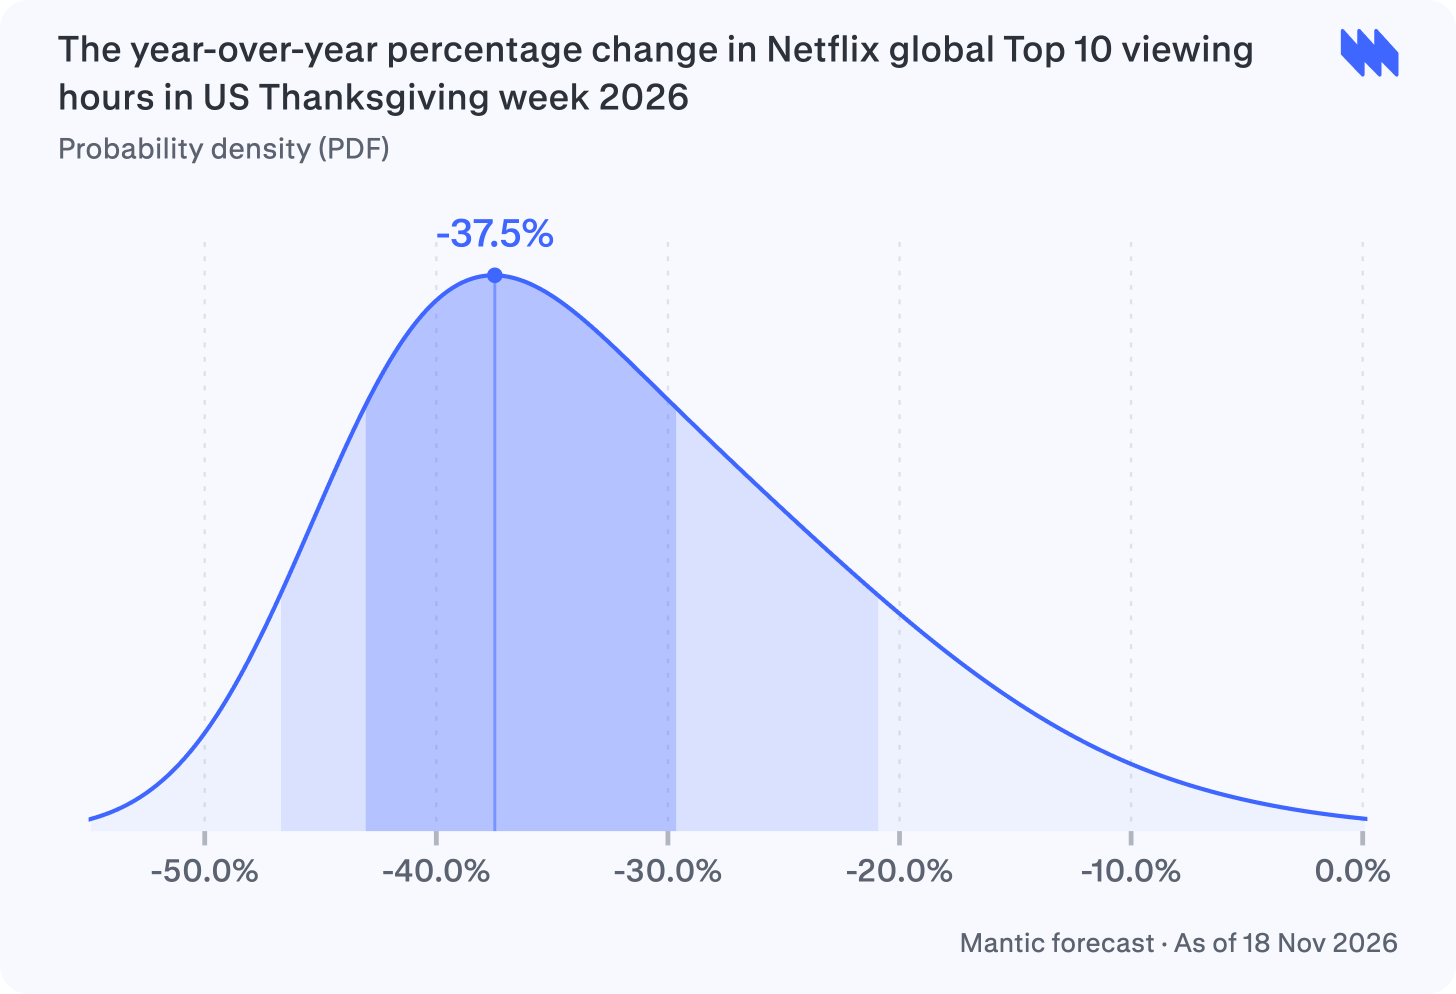
I give a 50% probability of a year-on-year change between −43.0% and −29.6% in Netflix’s global Top 10 viewing hours for Thanksgiving week 2026, with −37.5% most likely.
Netflix’s official data attribute 503.6 million of last Thanksgiving’s 935.3 million hours to Stranger Things. I expect a substantial decline without a comparable franchise launch this year.6
Netflix’s latest three weekly totals were 536–568 million hours. I use this weak recent level as my starting point, not last year’s exceptional holiday total.7
My main uncertainty is the rebound. I balance historically limited Thanksgiving uplift against stronger viewing from The Altruists and The Hunting Wives’ expanded international distribution.8
3. Frankfurt’s internet traffic record ↗
Frankfurt hit a record 22.30 Tbit/s on 10 November, when players could first download GTA VI. The download was over 200 GB, and the game was still nine days from release.9 Explore on Mantic ↗
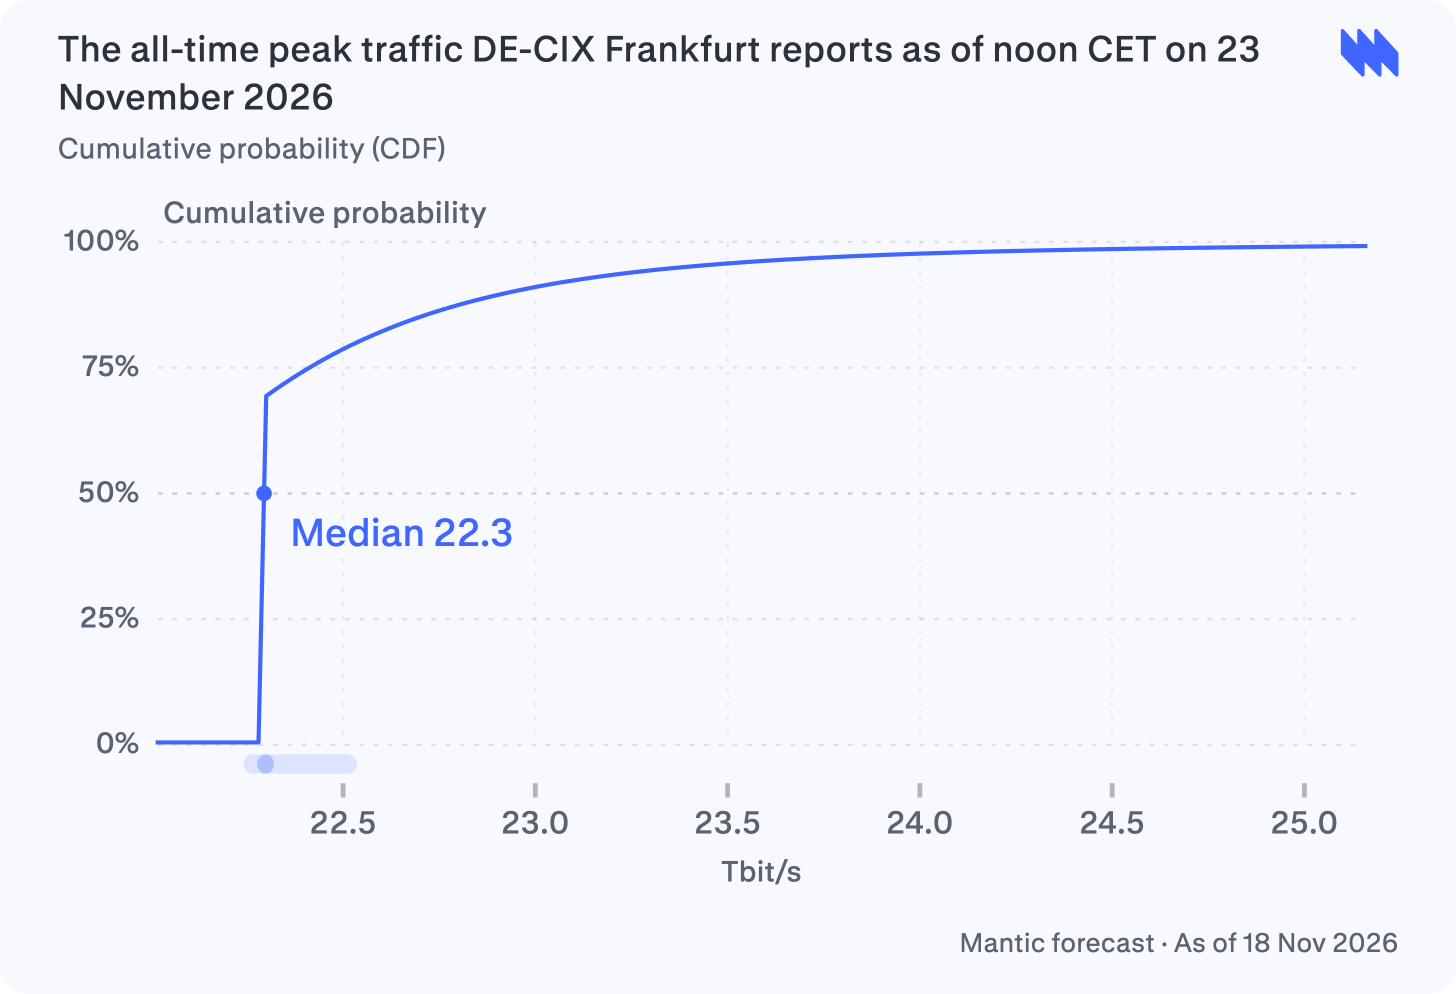
I give a 50% probability of 22.28–22.32 Tbit/s for Frankfurt’s all-time peak by noon CET on 23 November 2026, with 22.30 Tbit/s most likely.10
DE-CIX’s daily peaks on 11–17 November were 20.42–21.63 Tbit/s, below its 22.30 Tbit/s record. I therefore favour the record remaining unchanged.11
PlayStation and Forbes report that preloading began nine days before launch; boxed-edition buyers could also preload. I therefore expect less concentrated launch demand.12
I allow for the typical 1 Tbit/s Patch Tuesday uplift in DE-CIX’s data. That leaves an estimated 0.4–0.7 Tbit/s preload contribution and restrains my assumed launch boost.13
I retain higher outcomes for late purchases or another large patch because DE-CIX reported downloads exceeding 200 GB. Scaling possible surges to the observed record-day increase widens my range.14
4. The soundtrack’s UK chart position ↗
On 13 November, Phantom of the Opera led UK compilations and KPop Demon Hunters was third. GTA’s vinyl release gives Rockstar a way to turn players into record buyers.15 Explore on Mantic ↗
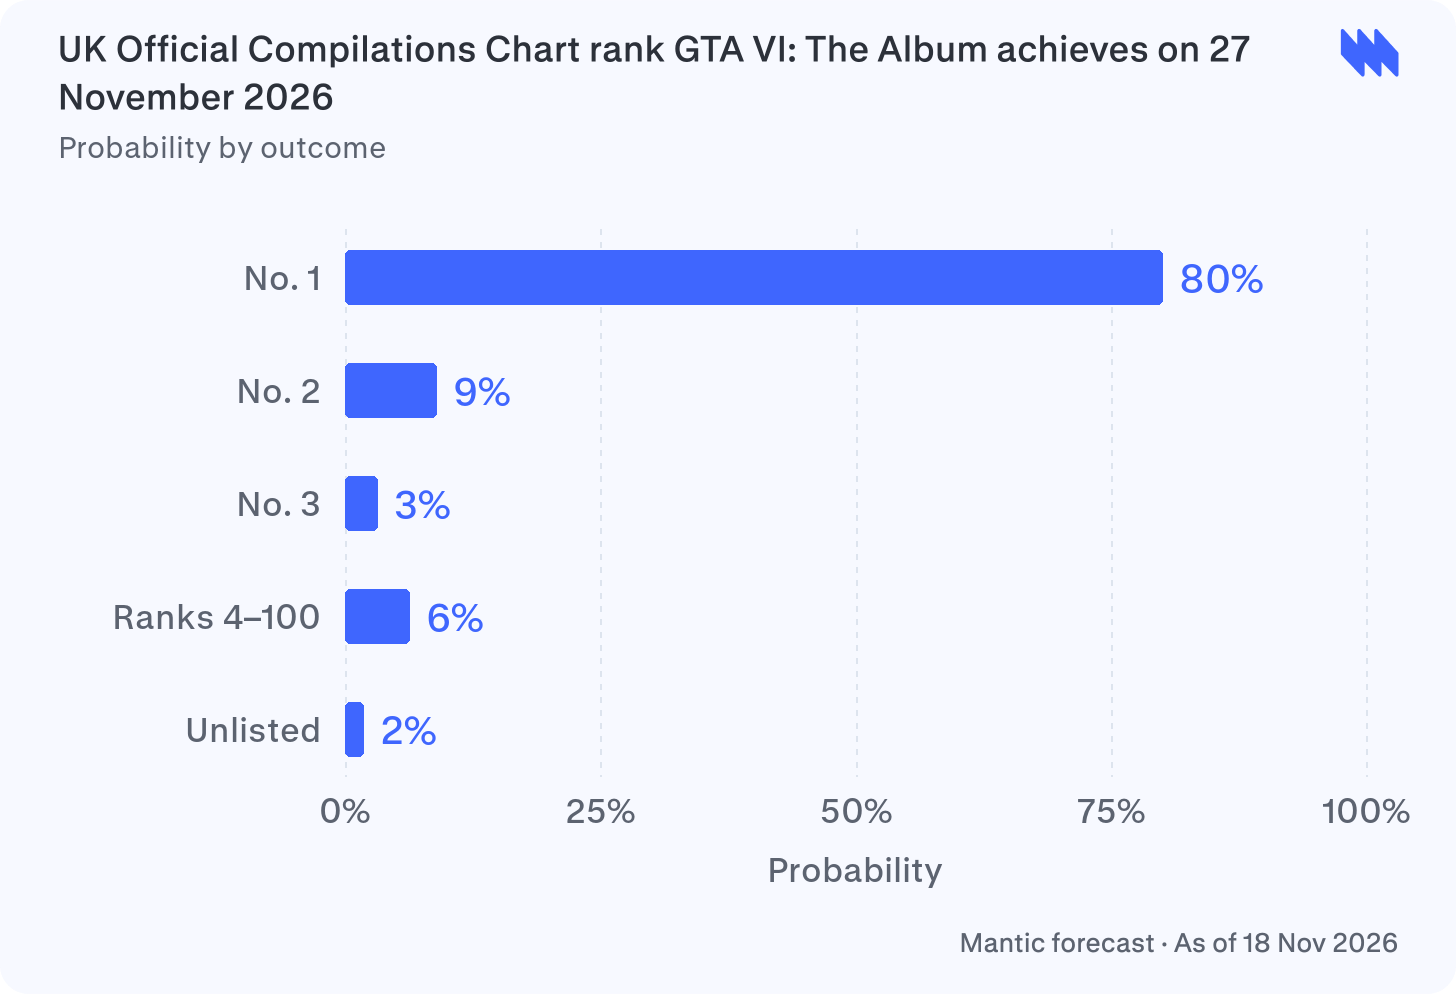
Amazon UK ranked the vinyl second across CDs & Vinyl. I take that as strong purchase demand against the latest compilation-chart winning total of about 5,000 units.16
I count a full week of purchases and streams: Apple UK and Blood Records list 20 November. Original-material compilations qualify for streaming units.17
I expect less pressure from NOW 125 because it will be in its second week. Its predecessor, NOW 122, fell from second to fifth in week two.18
My main uncertainty is how UK interest converts into purchases and streams. I allow weaker demand or stronger rivals to lower the rank, and release or eligibility failures to leave it unlisted.
5. The pre-Thanksgiving box office, year over year ↗
The comparable US and Canadian weekend took $182m in 2025, against a $215m inflation-adjusted historical median. This year, a new Hunger Games film gives cinemas their own blockbuster.19 Explore on Mantic ↗
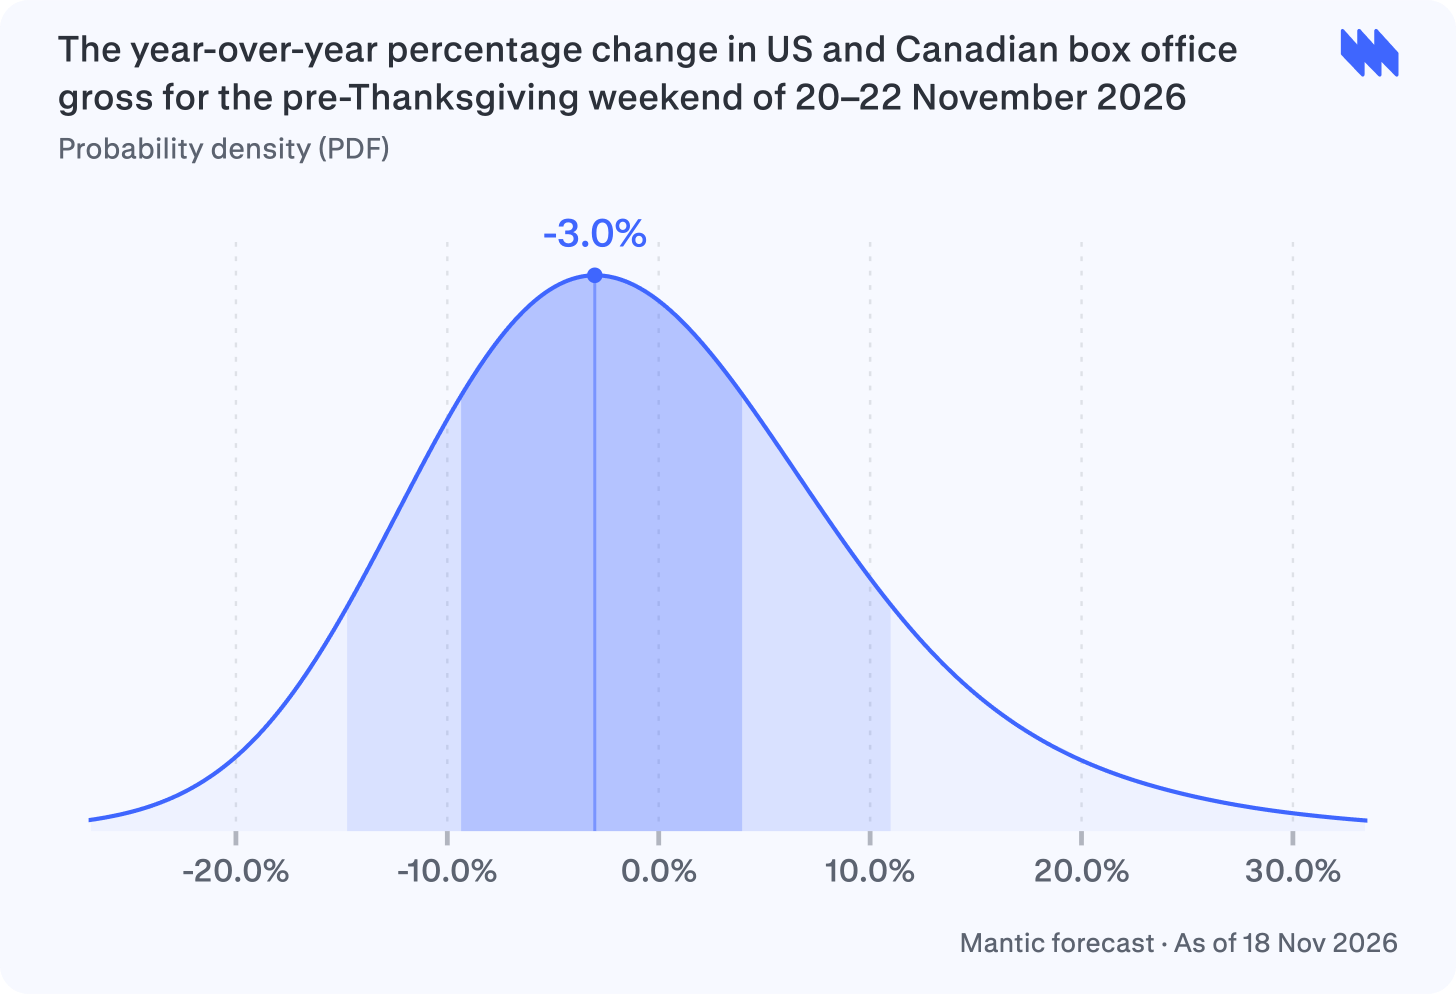
I give a 50% probability that US and Canadian box office gross for 20–22 November 2026 changes by between −9.3% and +3.9% year over year, with −3.0% most likely.
I anchor The Hunger Games: Sunrise on the Reaping near $122 million using Polymarket prices. That is below Wicked: For Good’s $147 million last year, pulling my forecast towards a year-over-year decline.20
I use Polymarket prices that already reflect mixed reviews. I keep my range wider because higher-opening brackets are thinly traded and preview grosses are still unavailable.21
I expect returning films to offset part of that shortfall: The Numbers recorded $86.7 million the previous weekend. I reduce their projected earnings for the steep screen losses seen on comparable weekends.22
I add revenue from I Play Rocky and Paper Tiger expanding wide. I allow both modest earnings and a much stronger contribution from Rocky because its release width remains uncertain.23
Remote, Wanted: Time Off. The forecast uses Remote’s own prior-year comparator and sample, not an economy-wide absenteeism measure. Its first sick-day watch is scheduled for 26 November. A numerical absolute sick-leave baseline has not yet been published.
Netflix’s official global weekly Top 10 data. The totals sum all 40 ranked entries across Netflix’s four global lists. In millions of hours, the week before US Thanksgiving and the week containing it were 704.9 and 766.0 in 2021, 762.7 and 991.0 in 2022, 486.1 and 559.5 in 2023, 568.8 and 634.3 in 2024, and 760.8 and 935.3 in 2025. The averages were 656.6 and 777.2. Weeks run Monday through Sunday. Release schedules vary by year.
Editorial note: the existing 22.30 Tbit/s record cannot decrease. Mantic’s saved CDF for run 400915 assigns no mass below 22.30. The 22.28 lower endpoint in the original rationale therefore appears to arise from density smoothing around the unchanged-record outcome. The native wording is preserved here; the chart uses the CDF.
The Numbers, 21–23 November 2025 weekend. The historical comparison is $214.8m, the median of eight pre-Thanksgiving Friday–Sunday weekends in 2016–19 and 2022–25, expressed in October 2026 dollars. The calculation excludes the pandemic years 2020–21. Each total is multiplied by 239.283 / that year’s November BLS admissions CPI; 239.283 is the October 2026 index. This index covers movies, theatres and concerts, so it is a broader ticket-price proxy. Historical totals: 2016, 2017, 2018, 2019, 2022, 2023, 2024, 2025. Neither comparison estimates GTA’s causal effect.Lionsgate’s North American release date for Sunrise on the Reaping.